Go back to the list of projects
Modular Markdown user and developer guide
23/10/2020

Project Presentation

Motivation

I recently finished a computer architecture engineering internship during which I developed a technical solution to a problem. When trying to explain what my work consisted in to friends, I kept coming back to the pen and paper to draw basic diagrams and schematics.

The scientific literature in educational technology supports that supplementing text-based instructions with diagrams improves considerably the transfer of knowledge. They are a crucial content format for educational content authoring systems.

To draw complex diagrams and schematics, there are many options. First, there are the general-purpose diagram creation tools (Lucid Charts, Microsoft Office Visio, Adobe Illustrator). They allow users to draw with basic shapes and simple templates for specific uses. However, the tools have to be generic enough and thus there is a trade-off between ease of use for a broad range of uses, and how much effort and time is necessary to draw more complex and specialized diagrams. Additionally, the only way to embed the resulting schematics in a document is usually to export it as a static image. The result is then not responsive to the document format (low portability) and tedious to edit (having to modify the original diagram, then export the new version).

For more specific usages, there exists dedicated software for each domain. As they are specialized in a certain diagram or schematic type, the tools are optimized for easier and faster production. However, such tools are hard to find and the few that exist are either old outdated software from defunct websites. Dedicated markup languages also exit but are almost entirely XML-based heavyweight languages with very low readability and user-friendliness. They are also often old projects that have been abandoned (see the MIT list in part 2). Consequently, they are tedious to implement in any existing modern platform or content-authoring tool.

Each branch of knowledge uses specialized diagrams and schematics to convey information. This content format is critical in STEM fields where there is a whole zoo of diagrams.

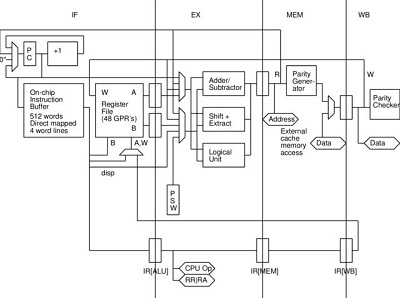
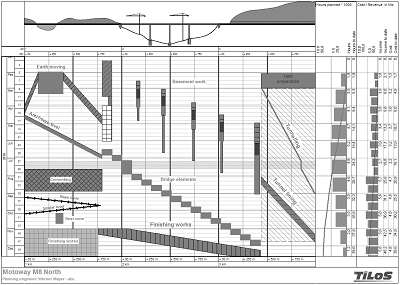
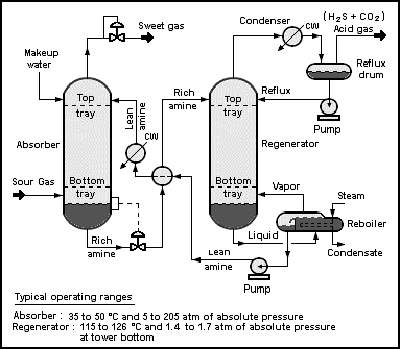
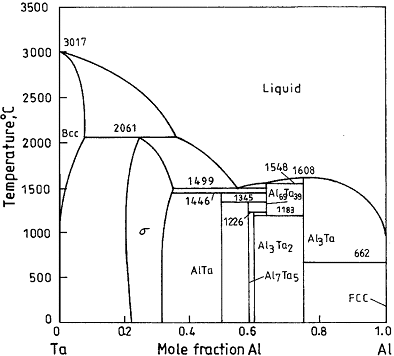
Examples of the diversity in diagram templates (from left to right and top to bottom) : Pipelined datapath diagram ; Time-distance diagram ; Process flow diagram ; Phase diagram.

A full list of the types of diagrams used in each field of study is nigh impossible to establish, let alone developing a tool specialized for each one. Thus, a more feasible approach to this problem is to develop a general-purpose framework with modular capabilities.

Modular Markdown

This project consists in extending the lightweight and popular markup language Markdown to allow it to support modules (add-ons). A particular syntax allows the user to call a module and feed it a specialized syntax optimized for one diagram format. Then the module parses this syntax and renders the diagram in a frame that Markdown can render like a regular image.

Such a tool is invaluable for many different uses :

The goal of the modularity of the language is to allow developers to create custom parsers adapted for a specific diagram or schematic template, thus using the most optimal syntax instead of a heavyweight user-unfriendly general-purpose canvas-drawing library. The following guide will explain how the basic syntax works for users, how to implement the base parser in a website, and how to develop new modules.

Universal Interactive Extensible Markup Language

This project is the first step towards the development of a more ambitious markup language based on the following principles :

Universal : the ability to author content in different formats including page-based documents, slide-based presentations, infinitely scrolling web pages and more, for different platforms including smartphones, tablets, computers, large displays and even prints.

Interactive : the ability to make the content interactive through the use of UI elements, quizzes and forms, branches and conditions for non-linear navigation, dynamic variables, animations, interactive data visualization, database interaction, and more.

Extensible : the ability to extend the functionality of the language using styling and formatting directives, API interfaces, and custom interactive visual element modules for diagrams and schematics.

This language is part of my even larger project for a free higher-education teaching platform, Scientia Potentia Est.

Basic Syntax

The syntax is based on Markdown with a few modifications.

Syntax element MMD syntax HTML generated Result
Headers
# Header 1
## Header 2
### Header 3
#### Header 4
##### Header 5
###### Header 6
<h1>Header 1</h1>
<h2>Header 2</h2>
<h3>Header 3</h3>
<h4>Header 4</h4>
<h5>Header 5</h5>
<h6>Header 6</h6>

Header 1

Header 2

Header 3

Header 4

Header 5
Header 6
Inline emphasis
Italics like *that* or like _that_

Bold like **that** or like __that__

Underline like ~that~

Strikethrough like ~~that~~

Highlight like ==that==

Superscript like ^that^

Subscript like ^^that^^

*==Mix== __~them~ to^ge^th^^er^^ !__ ~~Cool !~~*
Italics like <em>that</em> or like <em>that</em>

Bold like <strong>that</strong> or like <strong>that</strong>

Underline like <u>that</u>

Strikethrough like <s>that</s>

Highlight like <mark>that</mark>

Superscript like <sup>that</sup>

Subscript like <sub>that</em>

<em><mark>Mix</mark> <strong><u>them</u> to<sup>ge</sup>th<sub>er</sub> !</strong> <s>Cool !</s></em>
Italics like that or like that

Bold like that or like that

Underline like that

Strikethrough like that

Highlight like that

Superscript like that

Subscript like that

Mix them together ! Cool !
Block emphasis
> Level 1 block

>> Level 2 block

>>> Level 3 block

>>>> Level 4 block

>>>>> Level 5 block

>>>>>> Level 6 block
<div class="mmd-blockem-1">Level 1 block</div>
<br>
<div class="mmd-blockem-2">Level 2 block</div>
<br>
<div class="mmd-blockem-3">Level 3 block</div>
<br>
<div class="mmd-blockem-4">Level 4 block</div>
<br>
<div class="mmd-blockem-5">Level 5 block</div>
<br>
<div class="mmd-blockem-6">Level 6 block</div>
Level 1 block

Level 2 block

Level 3 block

Level 4 block

Level 5 block

Level 6 block
Horizontal rule
---
<hr>

Dashes
This is -- a n-dash

This is --- a m-dash
This is – a n-dash
<br>
This is — a m-dash
This is – a n-dash

This is — a m-dash
Lists
1. Ordered list
2. With multiple elements

* Unordered list
* With bullet marker
  * And multilevel
  * Really deep
    1. Nested ordered list
    2. Mix the two
* It just works
<ol>
  <li>Ordered list</li>
  <li>With multiple elements</li>
</ol>
<ul>
  <li>Unordered list</li>
  <li>With bullet marker
    <ul>
      <li>And multilevel</li>
      <li>Really deep
        <ol>
          <li>Nested ordered list</li>
          <li>Mix the two</li>
        </ol>
      </li>
    </ul>
  </li>
  <li>It just works</li>
</ul>
  1. Ordered list
  2. With multiple elements
  • Unordered list
  • With bullet marker
    • And multilevel
    • Really deep
      1. Nested ordered list
      2. Mix the two
  • It just works
Images
![](image.png)

![Replacement text](image.png =300x200)

![Replacement text][imageref]

[imageref]: image.png
<img src="image.png" alt="">
<br>
<img src="image.png" alt="Replacement text" width="150" height="200">
<br>
<img src="image.png" alt="Replacement text">

Replacement text
Replacement text
Links
[Google](google.com)

[Google][linkref]

[linkref]: google.com
<a href="google.com">Google</a>
<br>
<a href="google.com">Google</a>
Google
Google
Code
Inline `code`.

``` python
def blockcode():
    return "it works"
```
Inline <code class="mmd-inline-code">code</code>.
<br>
<pre class="mmd-code"><code class="mmd-code-language-python">
def blockcode():
    return "it works"
</code></pre>
Inline code.
def blockcode():
    return "it works"
Table
| Tables        | Are           | Cool  |
| ------------- |:-------------:| -----:|
| col 3 is      | right-aligned | $1600 |
| col 2 is      | centered      |   $12 |
| zebra stripes | are neat      |    $1 |
<table>
  <thead>
    <tr>
      <th>Tables</th>
      <th style="text-align:center">Are</th>
      <th style="text-align:right">Cool</th>
    </tr>
  </thead>
  <tbody>
    <tr>
      <td>col 3 is</td>
      <td style="text-align:center">right-aligned</td>
      <td style="text-align:right">$1600</td>
    </tr>
    <tr>
      <td>col 2 is</td>
      <td style="text-align:center">centered</td>
      <td style="text-align:right">$12</td>
    </tr>
    <tr>
      <td>zebra stripes</td>
      <td style="text-align:center">are neat</td>
      <td style="text-align:right">$1</td>
    </tr>
  </tbody>
</table>
Tables Are Cool
col 3 is right-aligned $1600
col 2 is centered $12
zebra stripes are neat $1
Diagram module
::: piechart
%radius: 80
%stroke-width: 1
%stroke-color: black
Cat: 50
Dog: 40
Rabbit: 20
Horse: 10
Other: 5 grey
:::
<svg class="mmd-diagram mmd-diagram-chart" width="300" height="200" version="1.1" xmlns="http://www.w3.org/2000/svg">
  <path fill="IndianRed" stroke="black" stroke-width="1" d="M 100 100 L 147.02282018339787 164.72135954999578 A 80 80 0 0 0 100 20 Z"></path>
  <path fill="SteelBlue" stroke="black" stroke-width="1" d="M 100 100 L 21.417019941704908 114.99050516685797 A 80 80 0 0 0 147.02282018339787 164.72135954999578 Z"></path>
  <path fill="DarkSeaGreen" stroke="black" stroke-width="1" d="M 100 100 L 45.23623152570488 41.682509806287094 A 80 80 0 0 0 21.417019941704908 114.99050516685797 Z"></path>
  <path fill="GoldenRod" stroke="black" stroke-width="1" d="M 100 100 L 80.10480902681164 22.5133471097095 A 80 80 0 0 0 45.23623152570488 41.682509806287094 Z"></path>
  <path fill="Grey" stroke="black" stroke-width="1" d="M 100 100 L 99.99999999999999 20 A 80 80 0 0 0 80.10480902681164 22.5133471097095 Z"></path>
  <rect x="220" y="55" width="15" height="10" fill="IndianRed"></rect>
  <text x="240" y="65" font-size="0.8em" font-family="Roboto">Cat</text>
  <rect x="220" y="75" width="15" height="10" fill="SteelBlue"></rect>
  <text x="240" y="85" font-size="0.8em" font-family="Roboto">Dog</text>
  <rect x="220" y="95" width="15" height="10" fill="DarkSeaGreen"></rect>
  <text x="240" y="105" font-size="0.8em" font-family="Roboto">Rabbit</text>
  <rect x="220" y="115" width="15" height="10" fill="GoldenRod"></rect>
  <text x="240" y="125" font-size="0.8em" font-family="Roboto">Horse</text>
  <rect x="220" y="135" width="15" height="10" fill="Grey"></rect>
  <text x="240" y="145" font-size="0.8em" font-family="Roboto">Other</text>
</svg>
Cat Dog Rabbit Horse Other

Integration guide

To add Modular Markdown to your website or an other web-based service, you only need the mmd.js and mmd.css files. Then, you can parse MMD code by feeding it to the parseMMD() function which returns the preformatted rendered HTML raw text.

The optional argument is a dictionary of modules with the key being the string identifier used at the top of the diagram module syntax ("piechart" in the example above), and the value is the JavaScript function of the module (see the guide for module developers).

<html>
    <head>
        <link rel="stylesheet" href="mmd.css">
    </head>
    <body>
        <div id="content">
            <textarea id="mmd"></textarea>
            <div id="formatted"></div>
        </div>
        <script src="chart.js"></script>
        <script src="plot.js"></script>
        <script src="mmd.js"></script>
        <script>
            let modules = {
                "chart":parseChart,
                "plot":parsePlot
            }
            let html = parseMMD($('#mmd').value, modules);
            $('#formatted').innerHTML = html;
        </script>
    </body>
</html>

Module development guide

Basic syntax

A diagram module is implemented with a main parsing function that takes the raw syntax code (everything inside the ::: block except the module identifier) as an input and outputs the inside of the SVG element.

function parseMyModule(raw) {
    let out = "";
    // parse the raw code
    // build the SVG elements
    // return the inner SVG code
    return out;
}

The module can then be used as explained in the integration guide above.

<html>
    <head>
        <link rel="stylesheet" href="mmd.css">
    </head>
    <body>
        <div id="content">
            <textarea id="mmd"></textarea>
            <div id="formatted"></div>
        </div>
        <script src="my-module.js"></script>
        <script src="mmd.js"></script>
        <script>
            let modules = {
                "mymodule":parseMyModule
            }
            let html = parse($('#mmd').value, modules);
            $('#formatted').innerHTML = html;
        </script>
    </body>
</html>

In order to make the development of modules faster and easier, I provide two pre-parsing functions that parses the raw syntax into a JavaScript object. The first language (SDSL) parses a syntax similar to YAML and is useful for modules aimed at data-based diagrams. The second language (SGML) parses a heavily customizable syntax useful for modules aimed at graph-based diagrams (data with a node-relationship structure).

Simple Data Serialization Language (SDSL)

function parseMyModule(raw) {
    let out = "";
    let data = parseSDSL(raw);
    // interpret the data dictionary object
    // build the SVG elements
    // return the inner SVG code
    return out;
}
<html>
    <head>
        <link rel="stylesheet" href="mmd.css">
    </head>
    <body>
        <div id="content">
            <textarea id="mmd"></textarea>
            <div id="formatted"></div>
        </div>
        <script src="sdsl.js"></script>
        <script src="my-module.js"></script>
        <script src="mmd.js"></script>
        <script>
            let modules = {
                "mymodule":parseMyModule
            }
            let html = parse($('#mmd').value, modules);
            $('#formatted').innerHTML = html;
        </script>
    </body>
</html>

You can use the following modules as code templates to build your data-based diagram module :

Simple Graph Modelling Language (SGML)

function parseMyModule(raw) {
    let out = "";
    let data = parseSGML(raw);
    // interpret the graph dictionary object
    // build the SVG elements
    // return the inner SVG code
    return out;
}
<html>
    <head>
        <link rel="stylesheet" href="mmd.css">
    </head>
    <body>
        <div id="content">
            <textarea id="mmd"></textarea>
            <div id="formatted"></div>
        </div>
        <script src="sgml.js"></script>
        <script src="my-module.js"></script>
        <script src="mmd.js"></script>
        <script>
            let modules = {
                "mymodule":parseMyModule
            }
            let html = parse($('#mmd').value, modules);
            $('#formatted').innerHTML = html;
        </script>
    </body>
</html>

You can use the following modules as code templates to build your graph-based diagram module :

Go back to the list of projects