This is the first in a series of projects around the simulation of the mechanisms of evolution and population dynamics. The goal of this project is to create a simple model of mutation and evolution through selection. Most of the code was first written in Python then translated to C++ for performance.
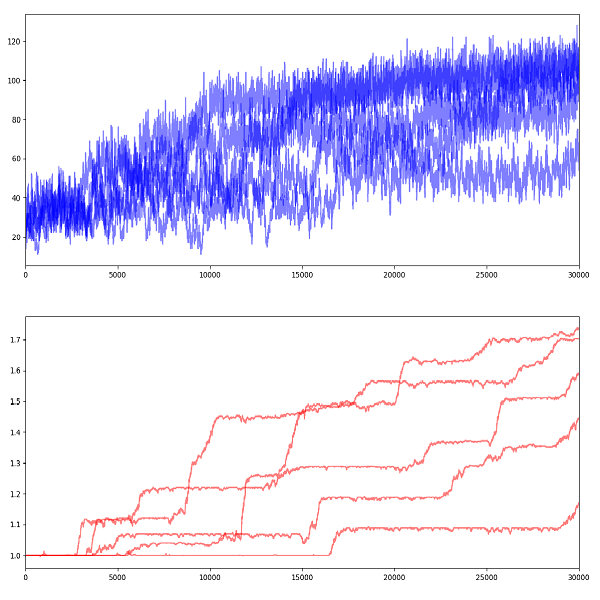
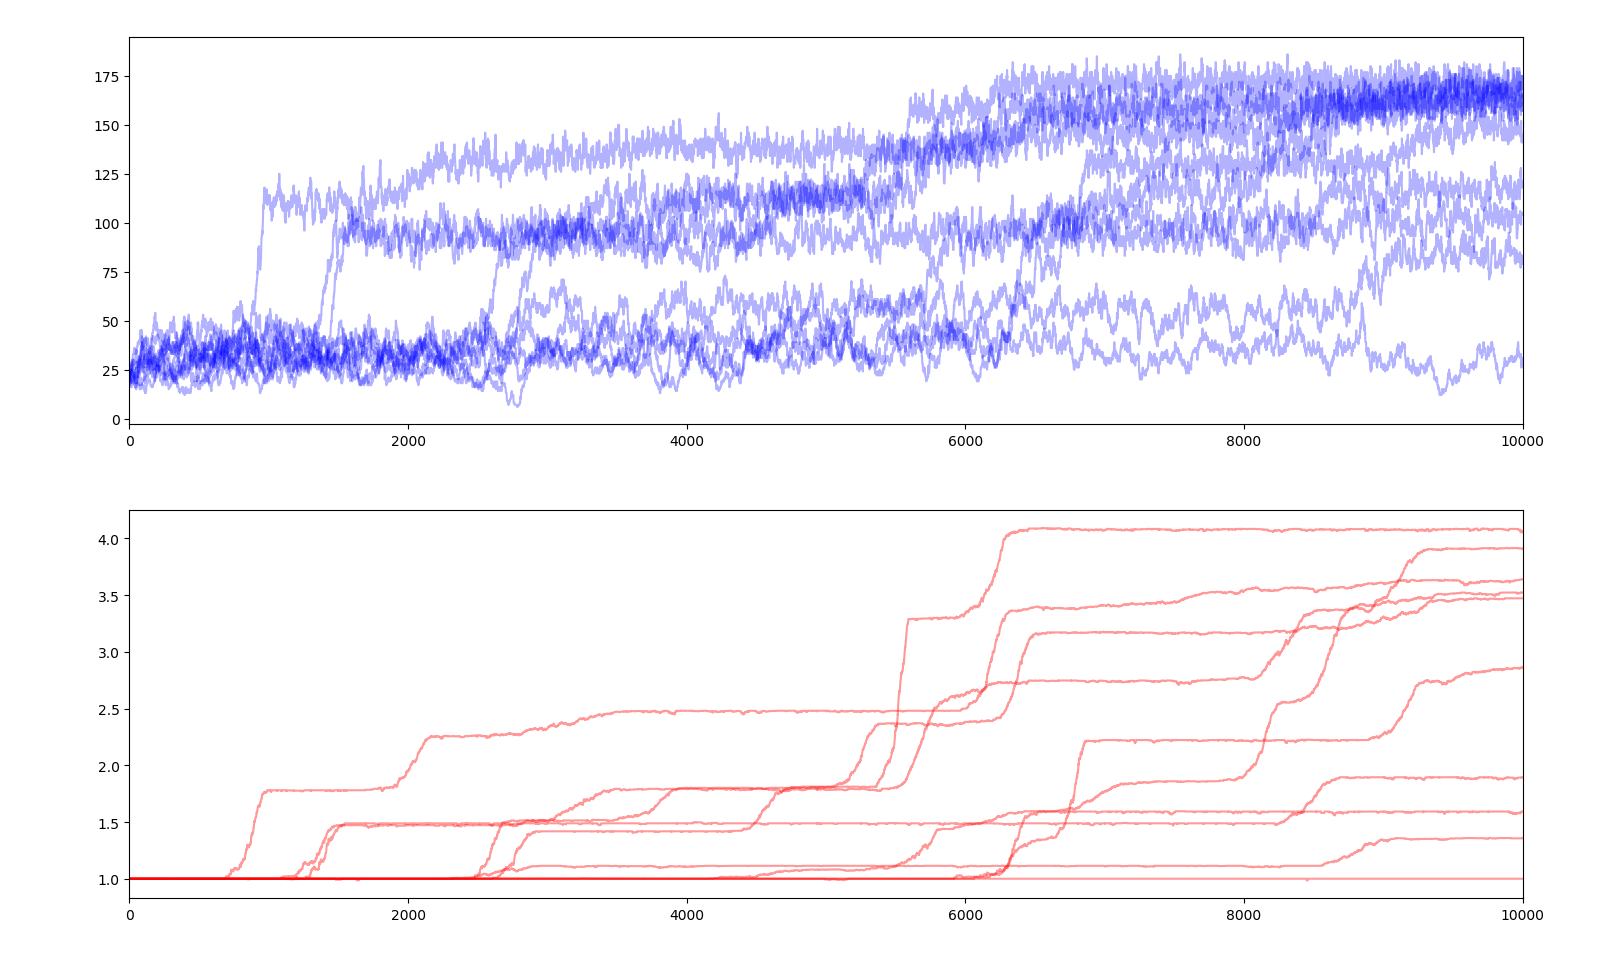
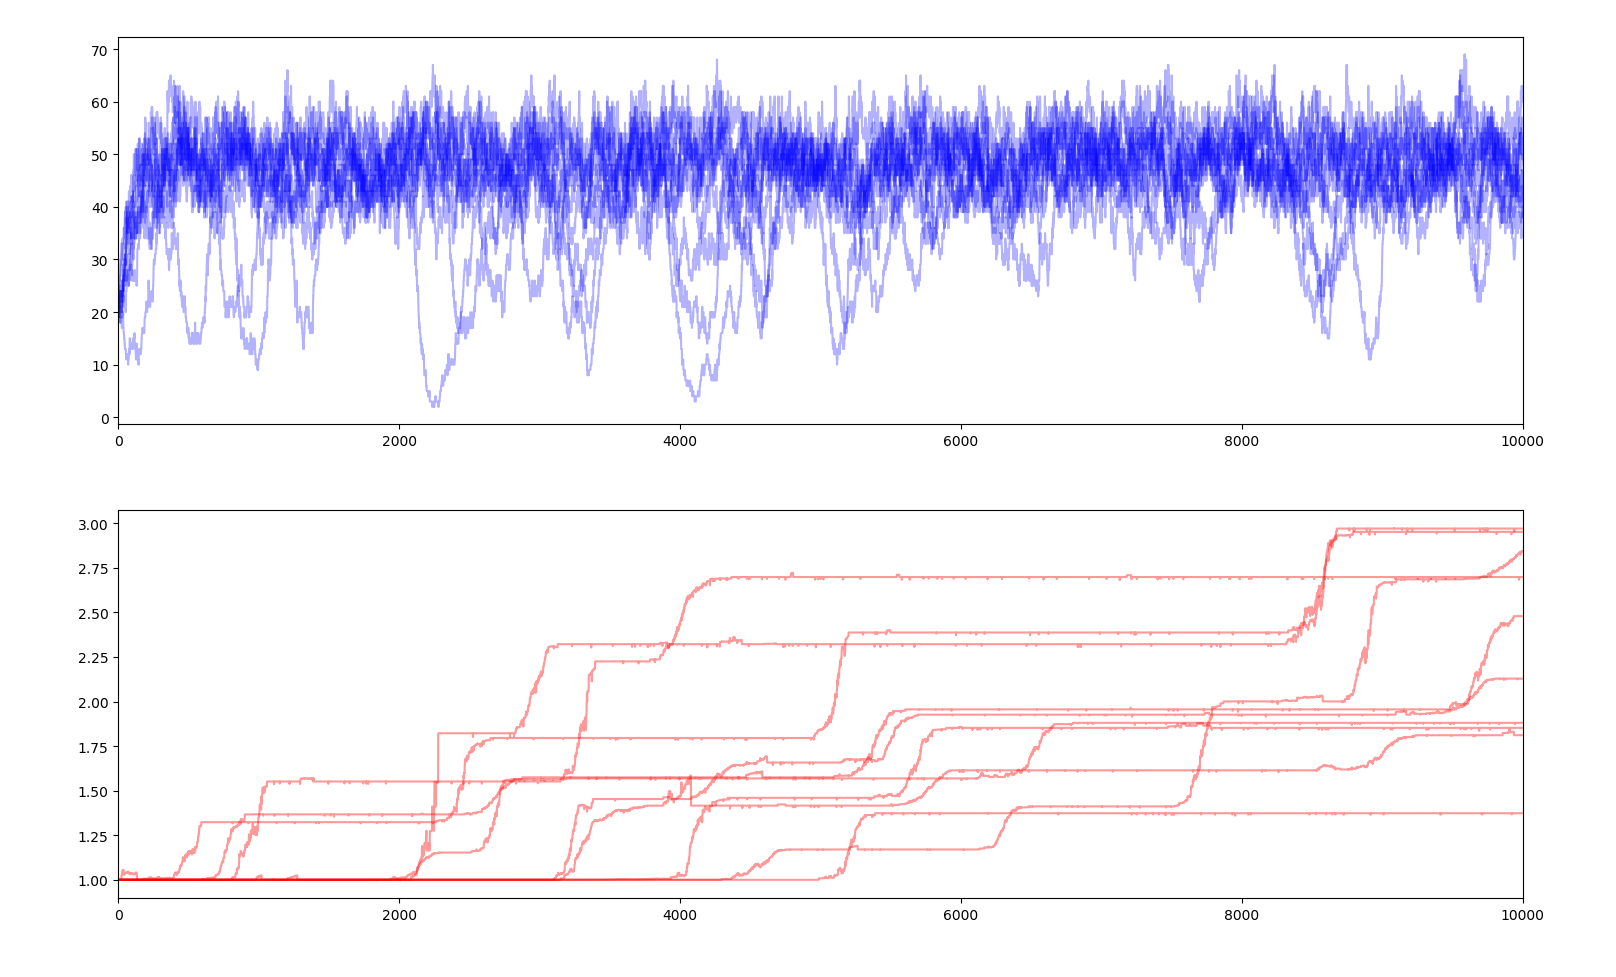
For all the simulation graphs that will be shown, the total population is displayed in blue and the average fitness in red.
First version
The first iteration of this model is simple and features the basic concepts on which the later iterations are built. We simulate a population of Creatures. A creature is the basic entity containing a list of Genes. Each gene is a simple floating point value representing the effect of the gene of the creature's fitness. A positive number means this gene helps the creature and vice-versa.
The simulation works in turns called years. Each year, every creatures are updated. First their probability of dying $$p_d$$ is calculated and a random number is generated to kill the creature. Then an other random number is generated for the creature to reproduce with probability $$p_r$$.
Reproduction involves a single creature whose genes are duplicated with random mutations : each gene of the list has a probability $$p_{gd}$$ of being destroyed during the reproduction and one gene can be created per reproduction with probability $$p_{gc}$$.
When a creature is spawned, its fitness $$f$$ is calculated as the sum of the effects of its genes plus the base fitness $$f_0$$. The value (effect) of new genes follow a normal distribution with a given mean and standard deviation then multiplied : $$m_g\times\mathcal{N}(\mu_g, \sigma_g^2)$$.
In order to prevent the population from growing too much, the probability for a creature to die $$p_d$$ depends on a crowding coefficient $$c_r$$, itself calculated with the current population size $$N$$, a carrying capacity factor $$c_{c}$$ and carrying capacity spread factor $$\sigma_{cc}$$. ££c_r=\frac{1}{1+exp \left( \frac{N-c_{c}}{\sigma_{cc}} \right) }££ ££p_d=exp\left(\frac{-c_rf}{\epsilon_d}\right)££
Here are the results with the following parameters.
| Parameter | Description | Value |
|---|---|---|
| $$N_0$$ | Starting population | $$20$$ |
| $$f_0$$ | Base fitness | $$1.0$$ |
| $$c_{c}$$ | Carrying capacity factor | $$100$$ |
| $$\sigma_{cc}$$ | Carrying capacity spread | $$50$$ |
| $$\epsilon_d$$ | Death probability fitness exponential coefficient | $$0.2$$ |
| $$p_{r}$$ | Reproduction probability | $$0.02$$ |
| $$p_{gd}$$ | Gene deletion probability | $$0.01$$ |
| $$p_{gc}$$ | Gene creation probability | $$0.001$$ |
| $$\mu_{g}$$ | Gene effect mean | $$0$$ |
| $$\sigma_{g}$$ | Gene effect standard deviation | $$0.5$$ |
| $$m_{g}$$ | Gene effect multiplier | $$0.5$$ |
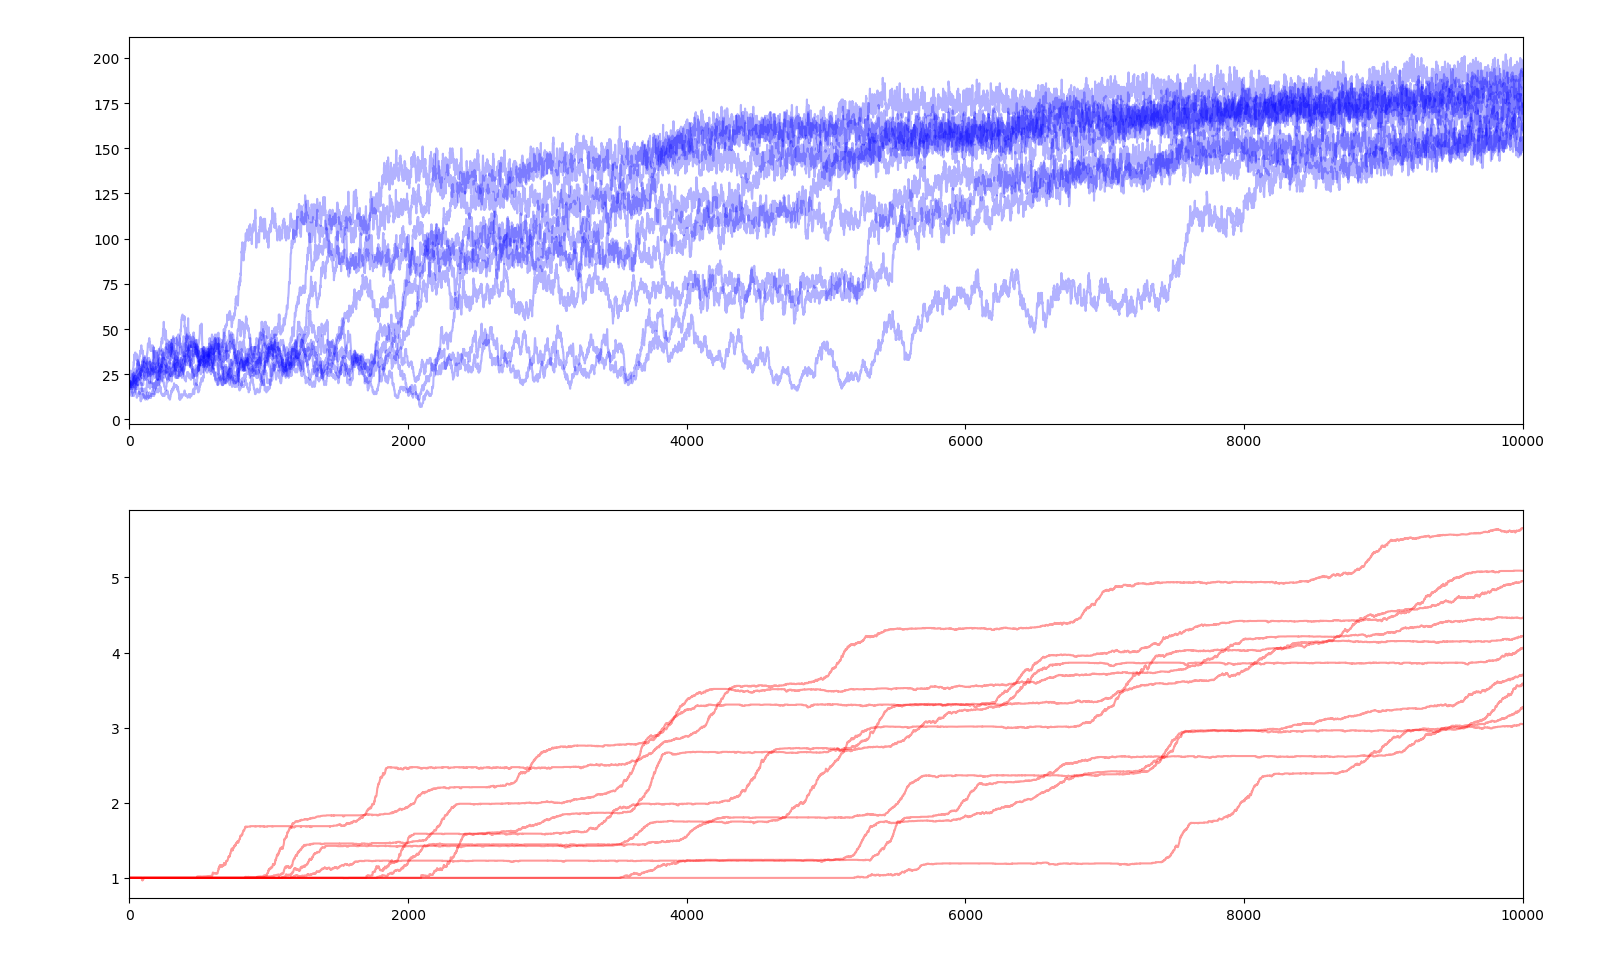
10 simulations of 10000 years
We can observe that when a new advantageous gene appears, it takes a few hundred years for it to be adopted by the whole population. The more positive the gene is, the faster it spreads. Also, as average fitness increases, the population size jumps to a higher plateau. Small dips in fitness reflect the destruction of genes or creation of negative genes, however they are only temporary as the creatures with sub-average fitness will have a higher probability of dying.
Second version
The first modification I made was the distribution of effects of genes. In real life biology, most mutations are negative. I searched the literature and found two relevant papers. The first paper, Distribution of fitness effects caused by random insertion mutations in Escherichia coli - Elena et al. Genetica 102/103: 349–358, 1998 shows a distribution centered around a slightly negative effect with a long tail in the negative and a small foot in the positive.
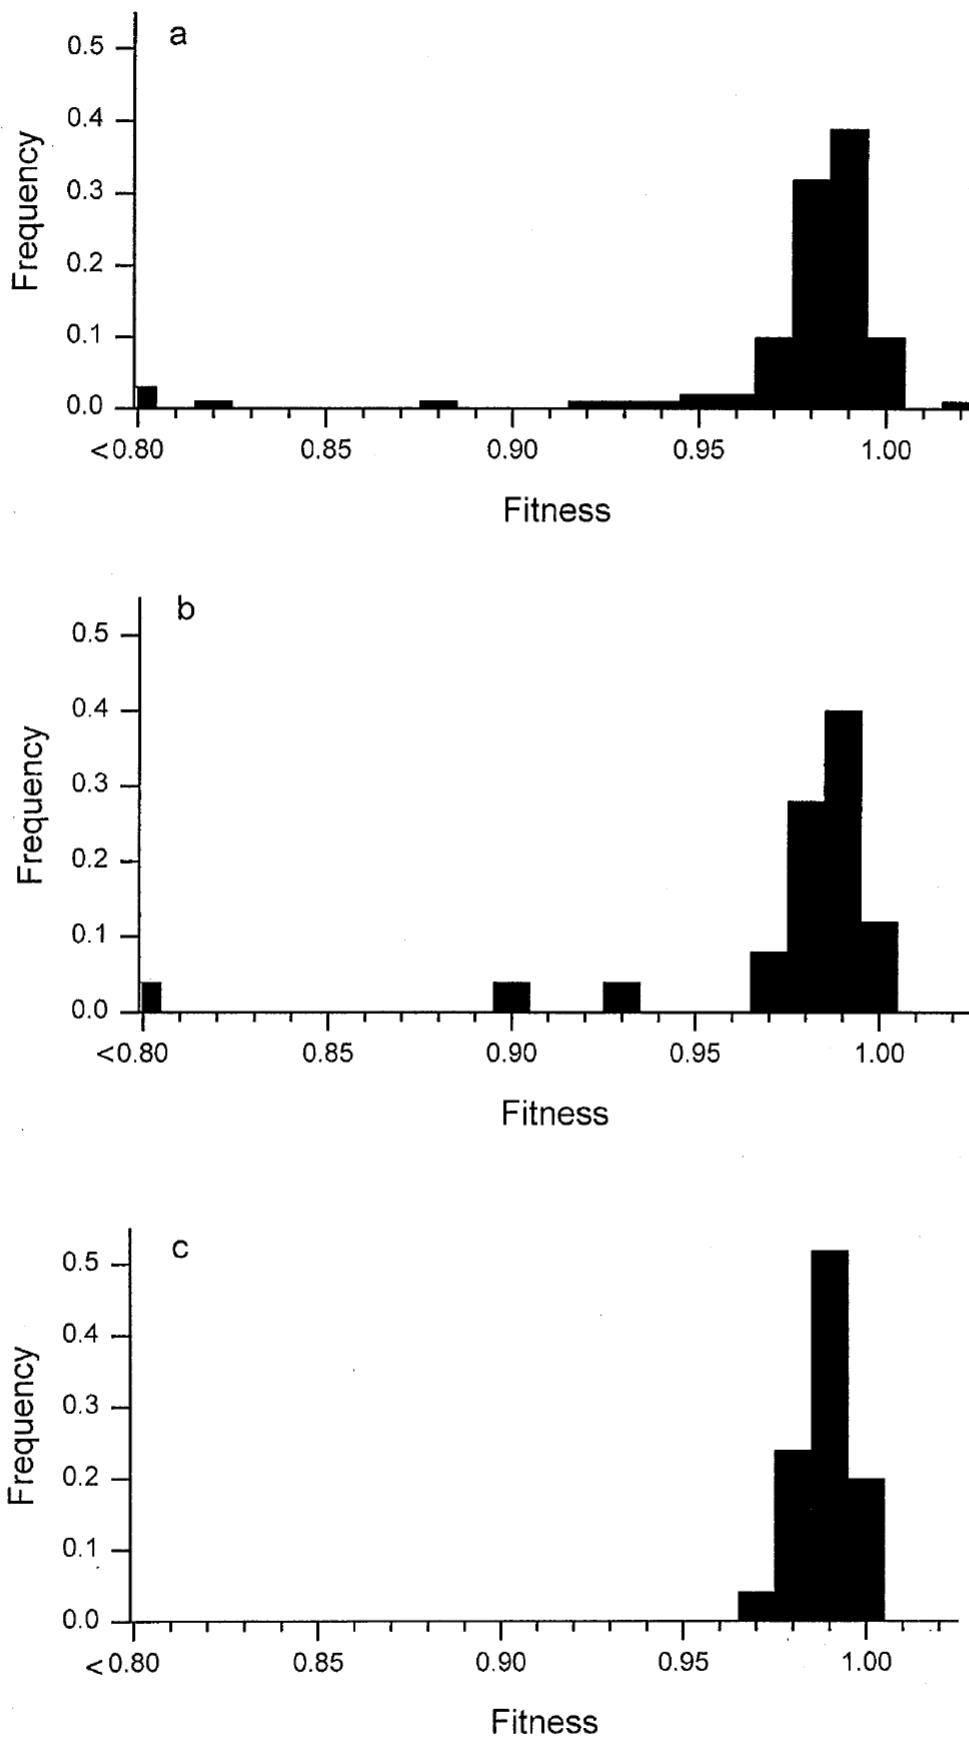
Distributions of relative fitness values measured for three sets of insertion mutations - Elena et al.
The second source I used is The distribution of fitness effects of new mutations - Eyre-Walker et al. Nature Reviews Genetics Vol 8 August 2007. The distribution is very similar.
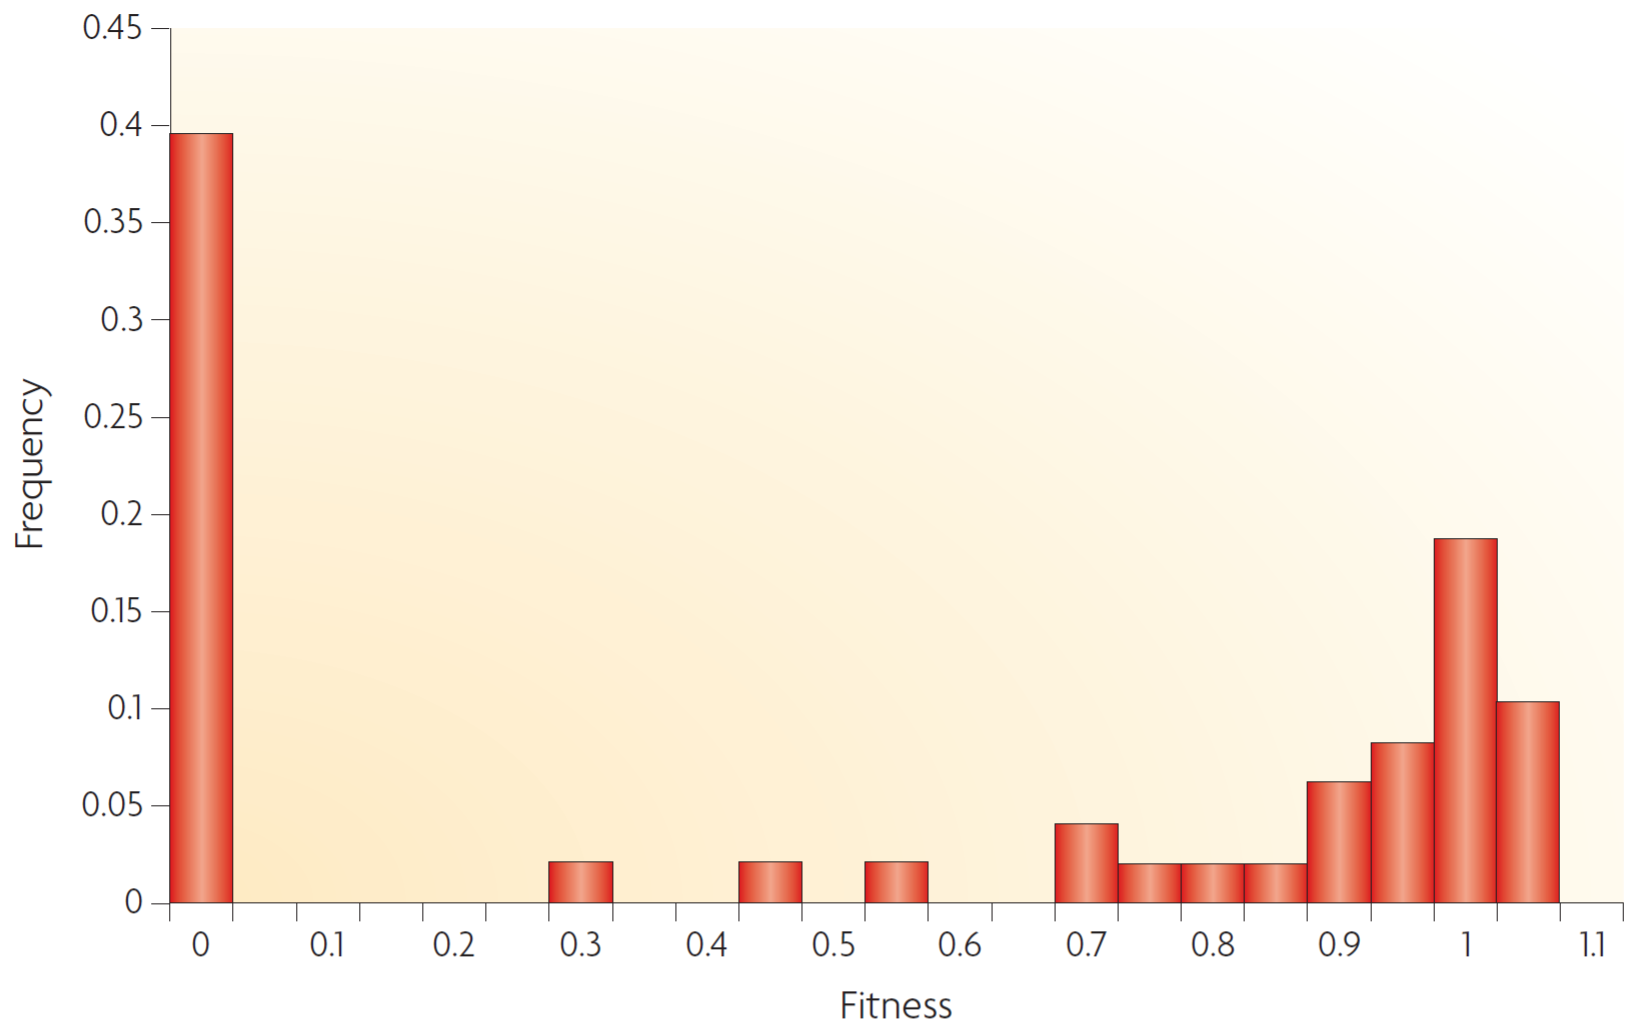
The distribution of fitness effects of new mutations - Eyre-Walker et al.
Therefore I chose a skewed normal distribution with skew, bias and multiplier $$m_g\times\mathcal{SN}(0,1,\gamma_g)+\delta_g$$. The multiplier was chosen to get about the same average fitness of the whole population at the end of the simulation
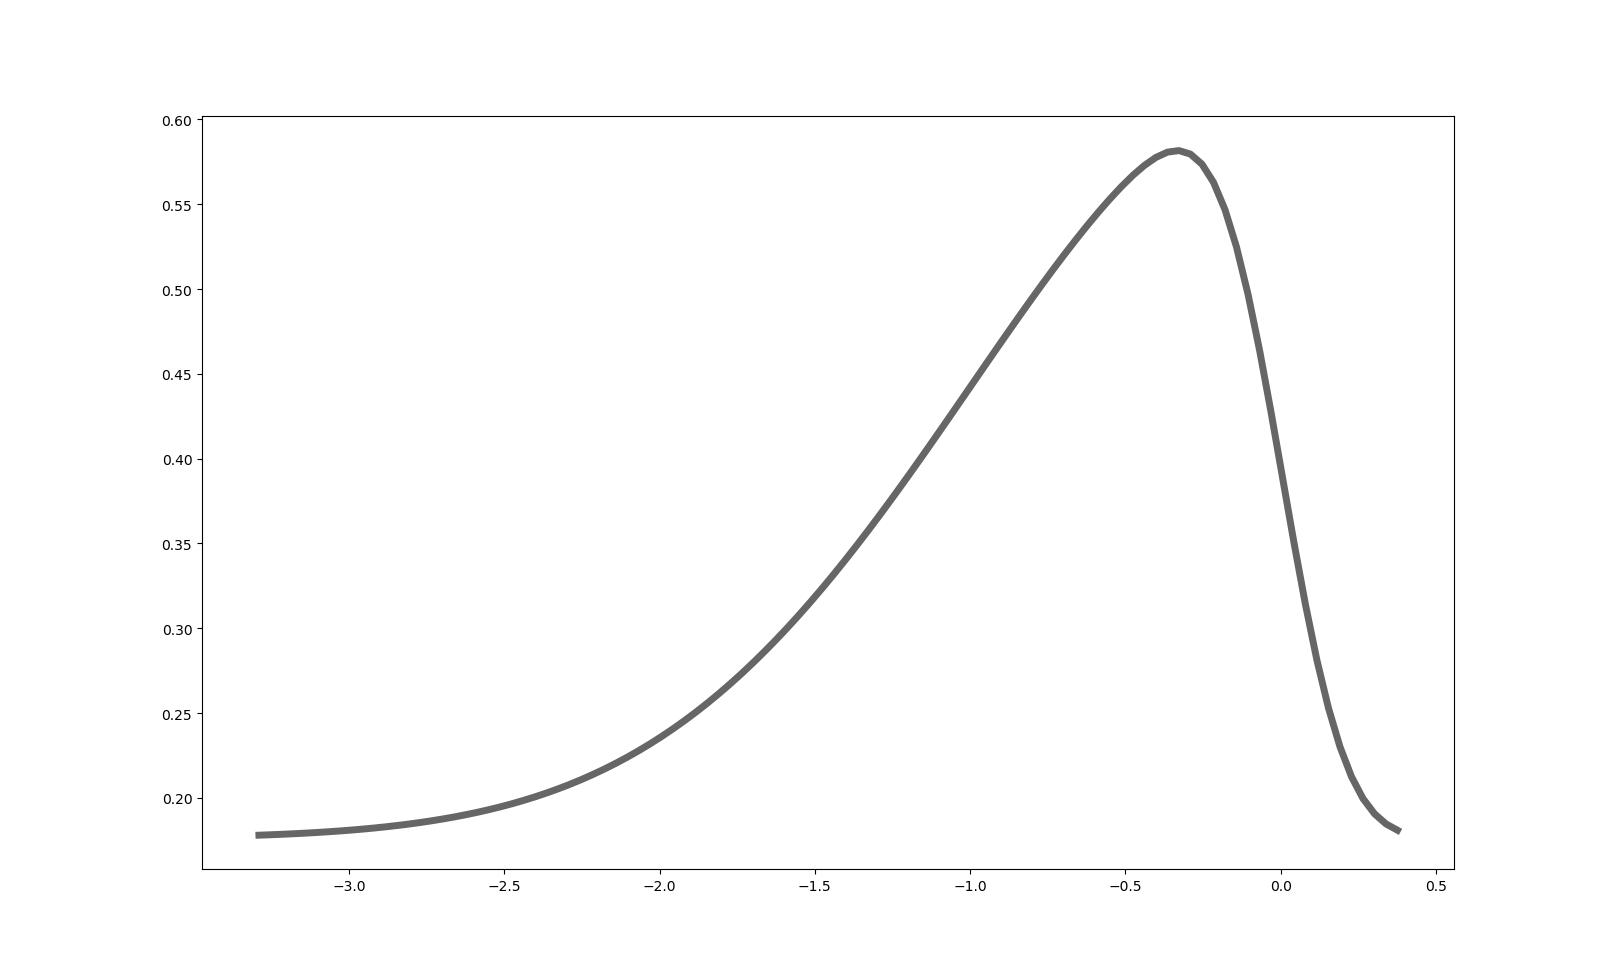
Skewed normal distribution $$0.55\times\mathcal{SN}(0,1,-6)+0.32$$
Here are the results with the following parameters.
| Parameter | Description | Value |
|---|---|---|
| $$N_0$$ | Starting population | $$20$$ |
| $$f_0$$ | Base fitness | $$1.0$$ |
| $$c_{c}$$ | Carrying capacity factor | $$100$$ |
| $$\sigma_{cc}$$ | Carrying capacity spread | $$50$$ |
| $$\epsilon_d$$ | Death probability fitness exponential coefficient | $$0.2$$ |
| $$p_{r}$$ | Reproduction probability | $$0.02$$ |
| $$p_{gd}$$ | Gene deletion probability | $$0.01$$ |
| $$p_{gc}$$ | Gene creation probability | $$0.001$$ |
| $$\gamma_{g}$$ | Gene effect skew | $$-6.0$$ |
| $$\delta_{g}$$ | Gene effect bias | $$0.32$$ |
| $$m_{g}$$ | Gene effect multiplier | $$0.55$$ |
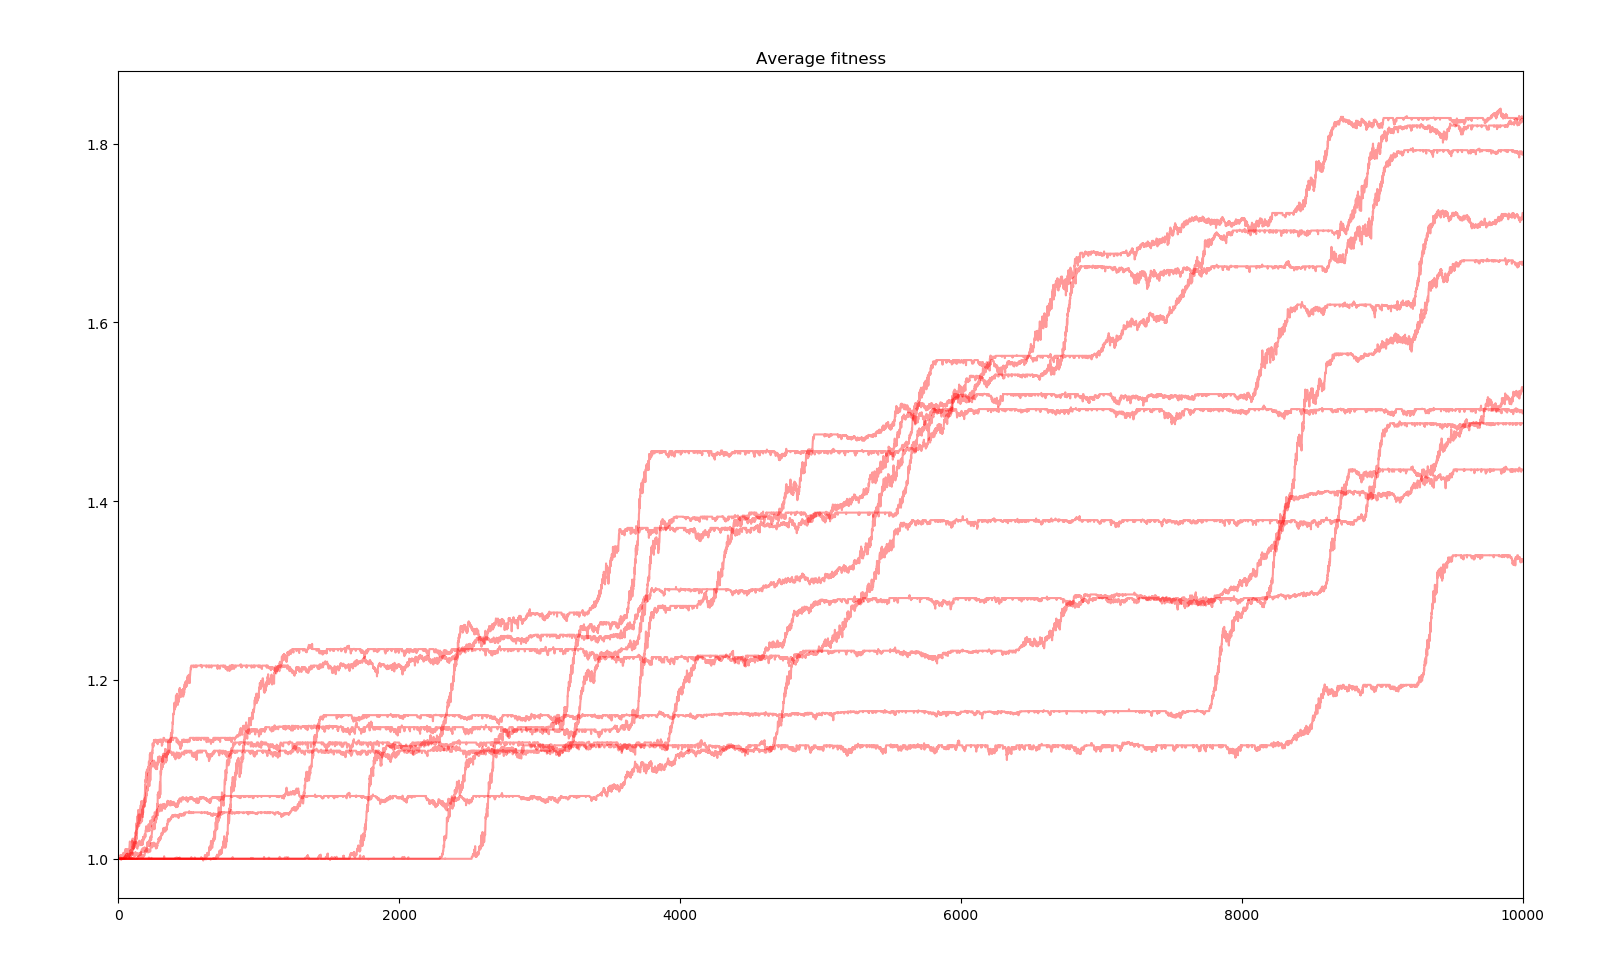
10 simulations of 10000 years
Compared to the previous simulation, we can observe more but smaller steps in average fitness.
Third version
The selection system is now based on energy and environment, basically food. The environment produces a given total amount of food per year $$E_{tot}$$ and each creature gets a share $$E_+$$ of the total depending on their fitness relative to the other creatures with a selectivity factor $$E_s$$. The food they collect is added to their energy $$E$$ and every year, a constant amount of energy is consumed $$E_-$$. Creatures with low energy are more likely to die. Initial creatures are given a basic amount of energy $$E_0$$ and child creatures spawned are given a basic amount of energy $$E_c$$. ££E_+=E_{tot}\times\left(\frac{f^{E_s}}{\Sigma{f}}\right)££ ££E(n+1)=E(n)+E_+-E_-££ ££p_d=1-(1-p_{d0})\times ease(E^{p_{ds}})££
The ease function is a quadratic ease in-out function defined as ££\begin{array}{cc} ease=\Bigg\{ & \begin{array}{cc} 0 & x\leq 0 \\ 2x^2 & x\leq \frac{1}{2} \\ -2x^2+4x-1 & x\leq 1 \\ 1 & x\geq 1 \end{array} \end{array}££
There is one interesting parameter here, the fitness selectivity coefficient $$E_s$$ which regulates how much the fitness affects the share of the food supply a creature gets. Bellow are the results of simulations with different values for this parameter. The values of the other parameters are listed bellow.
| Parameter | Description | Value |
|---|---|---|
| $$N_0$$ | Starting population | $$20$$ |
| $$f_0$$ | Base fitness | $$1.0$$ |
| $$E_0$$ | Initial population energy | $$1.0$$ |
| $$E_c$$ | Child energy | $$0.5$$ |
| $$E_{tot}$$ | Total yearly energy supply | $$10.0$$ |
| $$E_-$$ | Yearly energy consumption | $$0.1$$ |
| $$p_d$$ | Base death probability | $$0.01$$ |
| $$p_{ds}$$ | Death probability energy skew coefficient | $$1.0$$ |
| $$p_{r}$$ | Reproduction probability | $$0.02$$ |
| $$p_{gd}$$ | Gene deletion probability | $$0.01$$ |
| $$p_{gc}$$ | Gene creation probability | $$0.001$$ |
| $$\gamma_{g}$$ | Gene effect skew | $$-6.0$$ |
| $$\delta_{g}$$ | Gene effect bias | $$0.32$$ |
| $$m_{g}$$ | Gene effect multiplier | $$0.55$$ |
10 simulations of 10000 years $$E_s=0.1$$
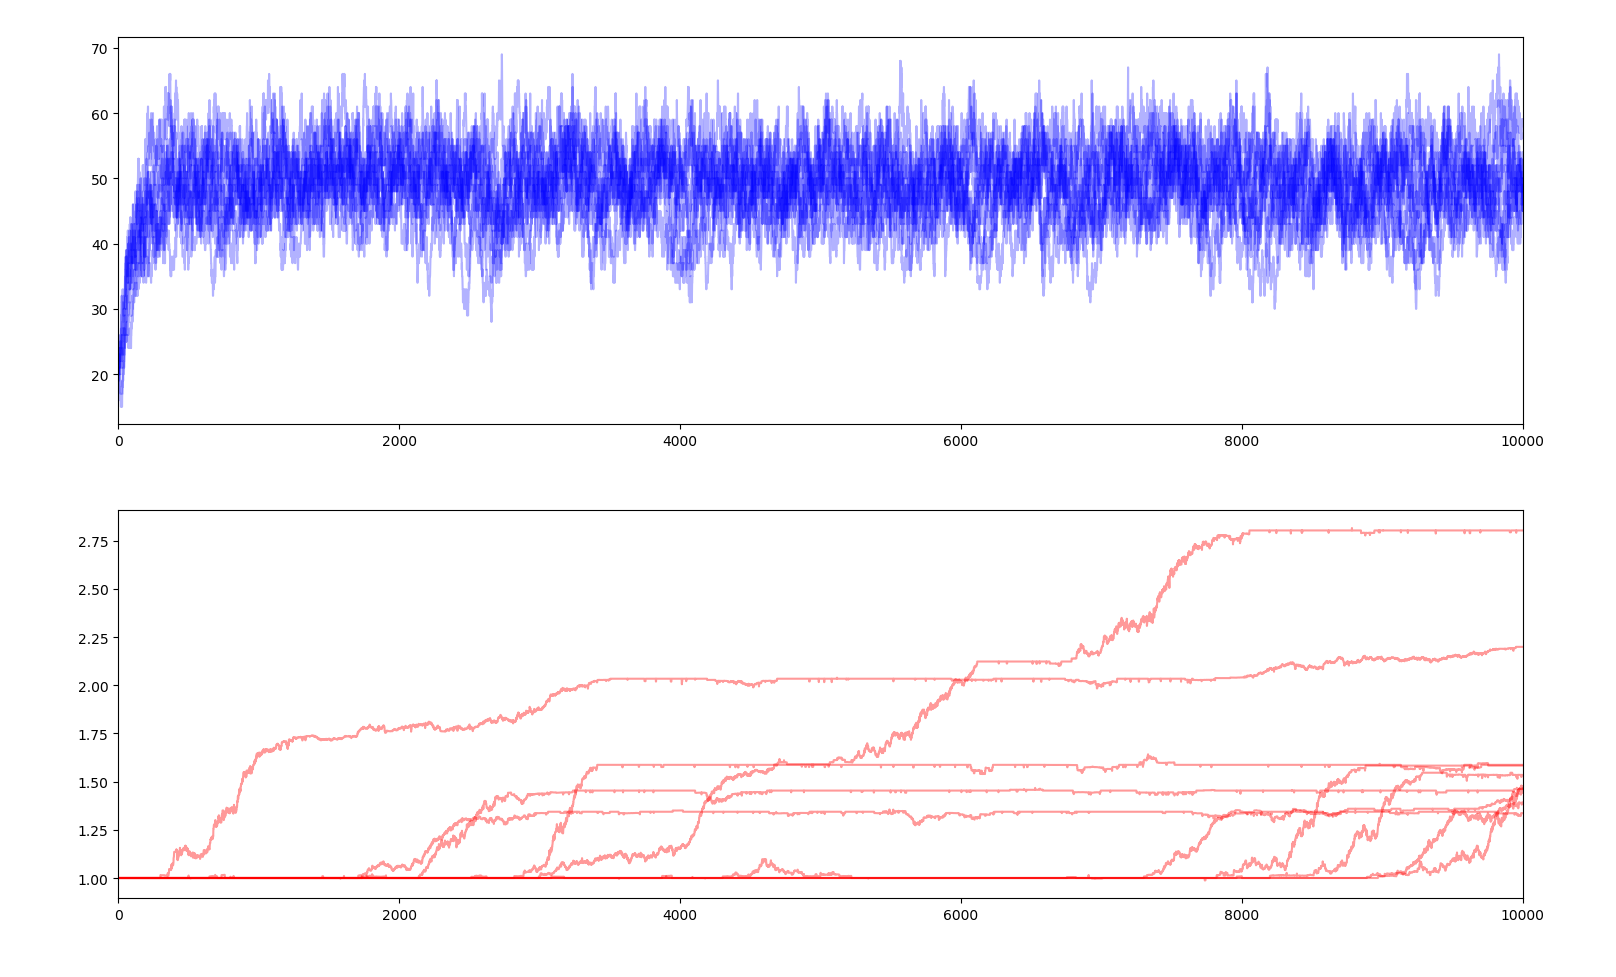
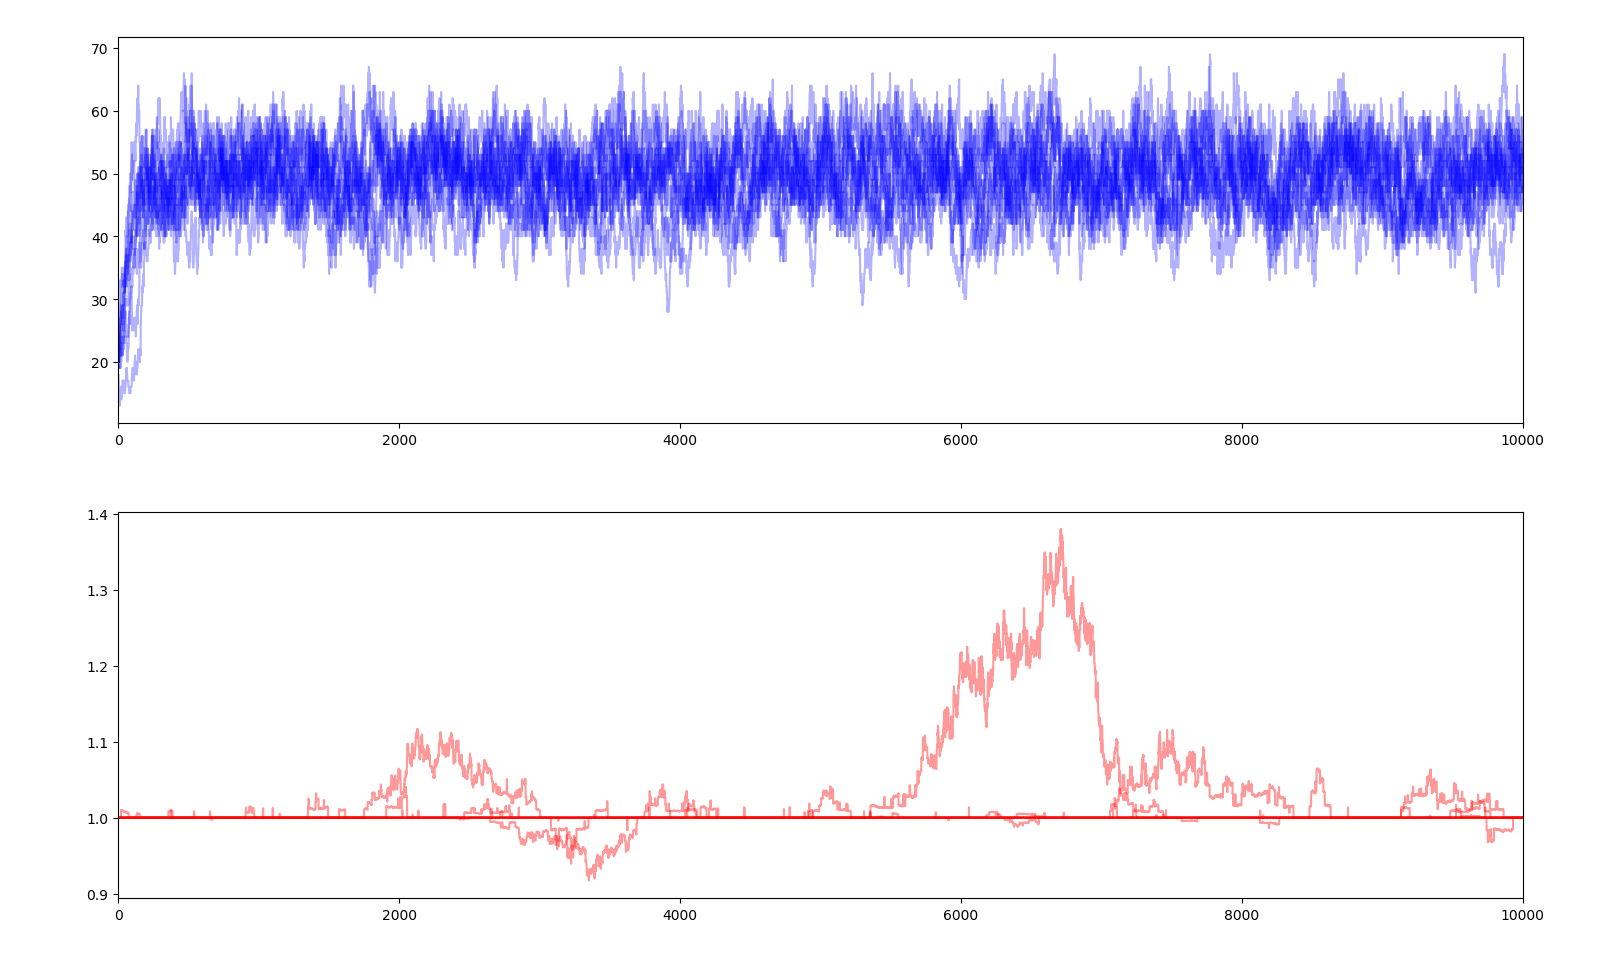
10 simulations of 10000 years $$E_s=1.0$$
10 simulations of 10000 years $$E_s=10.0$$
A selectivity coefficient close to 0 means that fitness has little impact on how much energy each creature gets, therefore small negative mutations can spread in the gene pool and positive mutations struggle to dominate and can simply disappear. Very little evolution is actually happening here and is very slow. On the contrary, a high selectivity coefficient makes every slightly negative gene a death sentence and every positive gene a guarantee of surviving and outperforming the others. Jumps in average fitness are faster and positive genes rarely fail to penetrate the gene pool. This parameter reflects the evolutionary pressure.
Moreover, with a very high selectivity factor, when a positive gene appears, the creatures owning that gene will have a substantially larger share of the total supply than the ones without the genes. Therefore, those without the gene will not get enough food to survive. Basically, the ones with the gene are so much better at getting the food that the others are left with nothing and quickly die. We can see this phenomenon as a sudden dip of the total population and the near extinction of the population.
We can also observe that fitness no longer allows the total population to increase way over the carrying capacity as the yearly energy supply is constant, the energy consumption of each creature is constant and the the share of the supply each creature gets only depends on how their fitness compares to the other creatures, and not how high it is in absolute. Each creature in a population of 50 creatures with a fitness of 1 each will get the same amount of energy as a population of 50 creatures with a fitness of 100 each. Therefore the graph of the population is no longer relevant.
Fourth version
This version changes the reproduction system. Now, birth costs energy to the parent and the child starts with a share $$\alpha_r$$ of the parent's energy. The probability of reproducing is no longer constant. It depends on the parent's energy. ££p_r=m_r\times \frac{1}{1-exp(-\sigma_rE^{\gamma_r}-\delta_r)}££
| Parameter | Description | Value |
|---|---|---|
| $$N_0$$ | Starting population | $$20$$ |
| $$f_0$$ | Base fitness | $$1.0$$ |
| $$E_0$$ | Initial population energy | $$1.0$$ |
| $$E_{tot}$$ | Total yearly energy supply | $$10.0$$ |
| $$E_-$$ | Yearly energy consumption | $$0.1$$ |
| $$E_s$$ | Fitness selectivity | $$1.0$$ |
| $$p_d$$ | Base death probability | $$0.01$$ |
| $$p_{ds}$$ | Death probability energy skew coefficient | $$1.0$$ |
| $$\alpha_{r}$$ | Share of the parent's energy given to the child | $$0.4$$ |
| $$m_{r}$$ | Reproduction probability multiplier | $$1.0$$ |
| $$\sigma_{r}$$ | Reproduction probability spread | $$8.0$$ |
| $$\gamma_{r}$$ | Reproduction probability skew | $$0.5$$ |
| $$\delta_{r}$$ | Reproduction probability bias | $$-10.0$$ |
| $$p_{gd}$$ | Gene deletion probability | $$0.01$$ |
| $$p_{gc}$$ | Gene creation probability | $$0.001$$ |
| $$\gamma_{g}$$ | Gene effect skew | $$-6.0$$ |
| $$\delta_{g}$$ | Gene effect bias | $$0.32$$ |
| $$m_{g}$$ | Gene effect multiplier | $$0.55$$ |
10 simulations of 10000 years
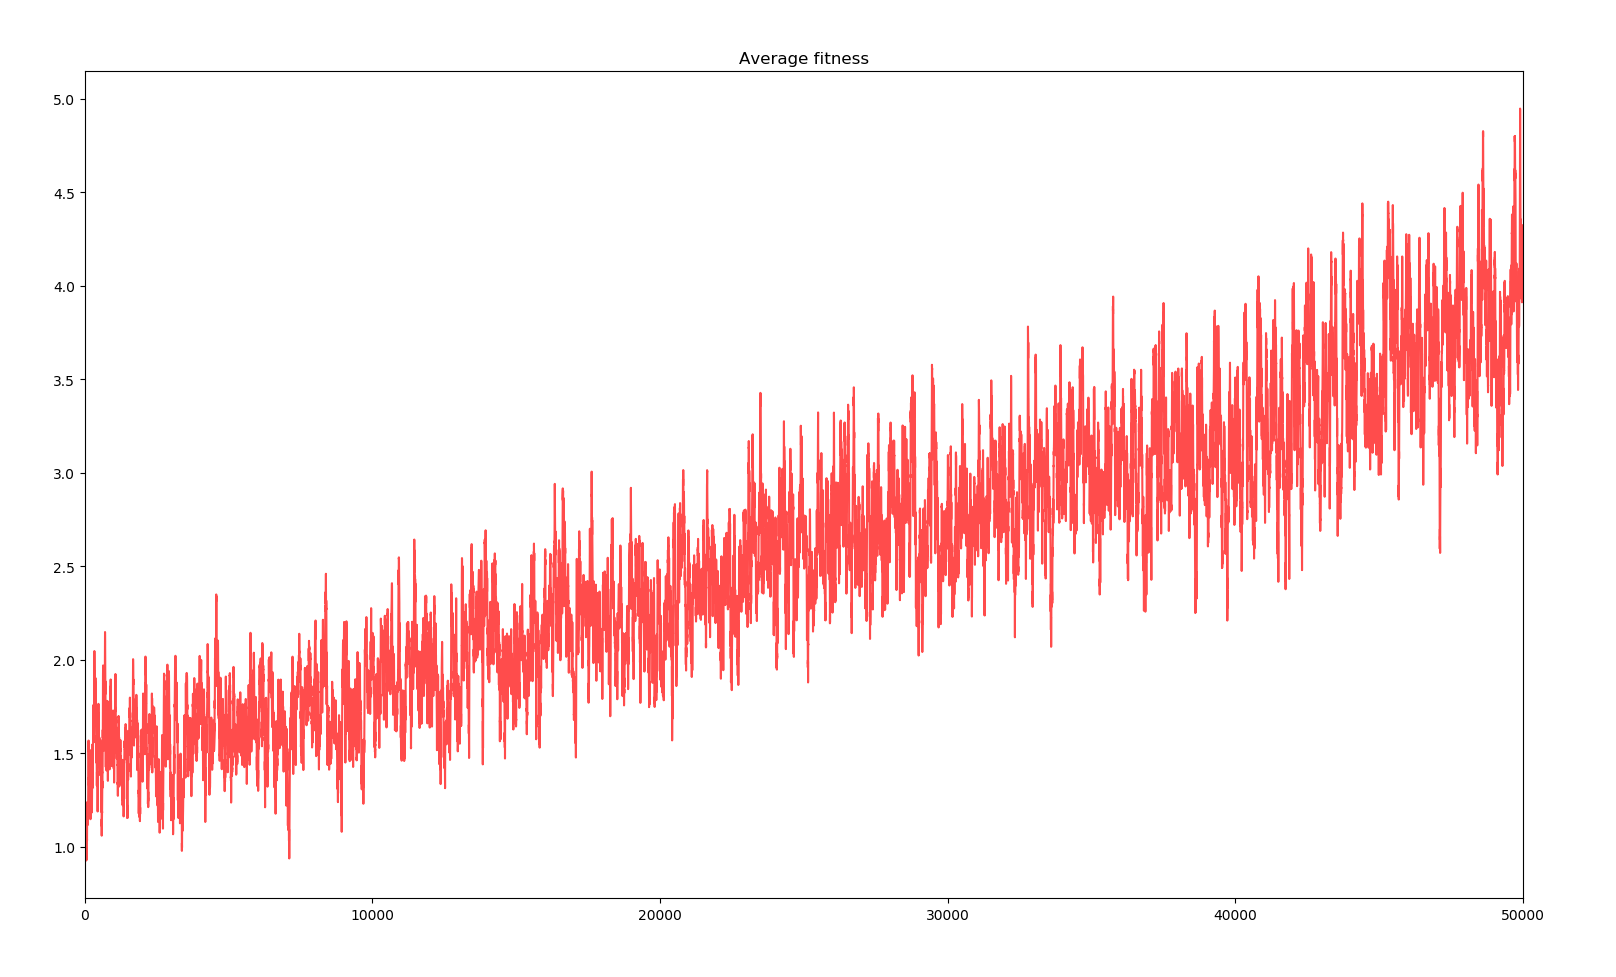
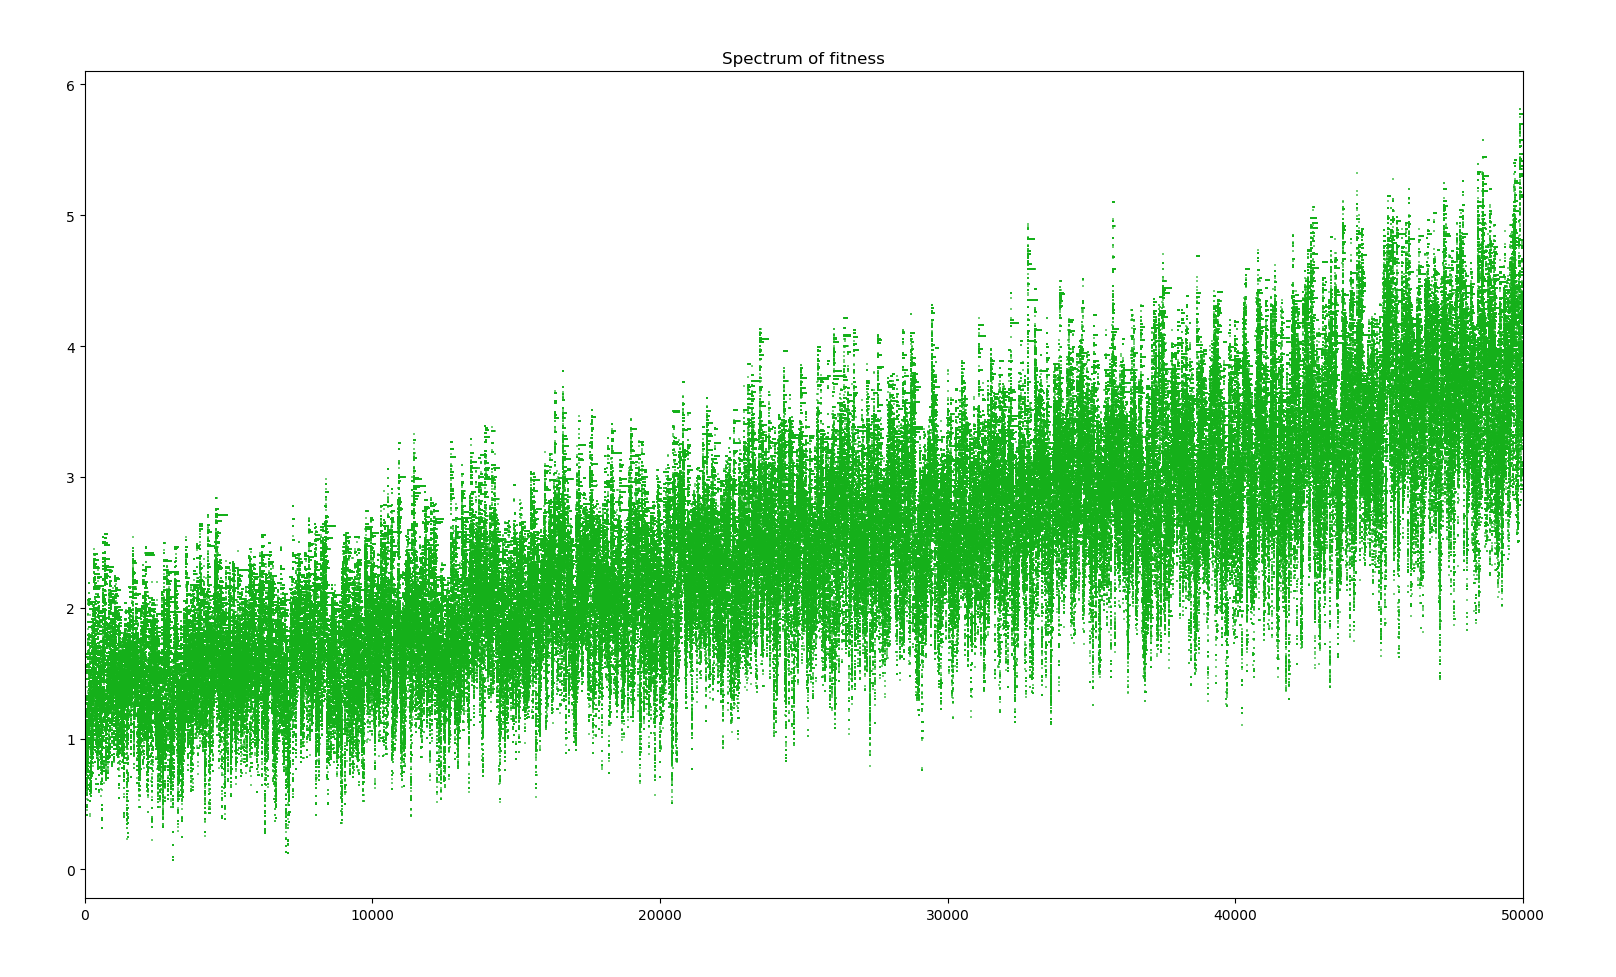
Here the effects of the changes are not really striking. The model is accurate enough to observe evolution and the changes only make it more accurate. However, average fitness is quite boring. I decided to monitor other states of the simulation but for only one simulation. Here is the most interesting : a spectrum of the fitness of the whole population to have an idea of the composition and the spread of genes.
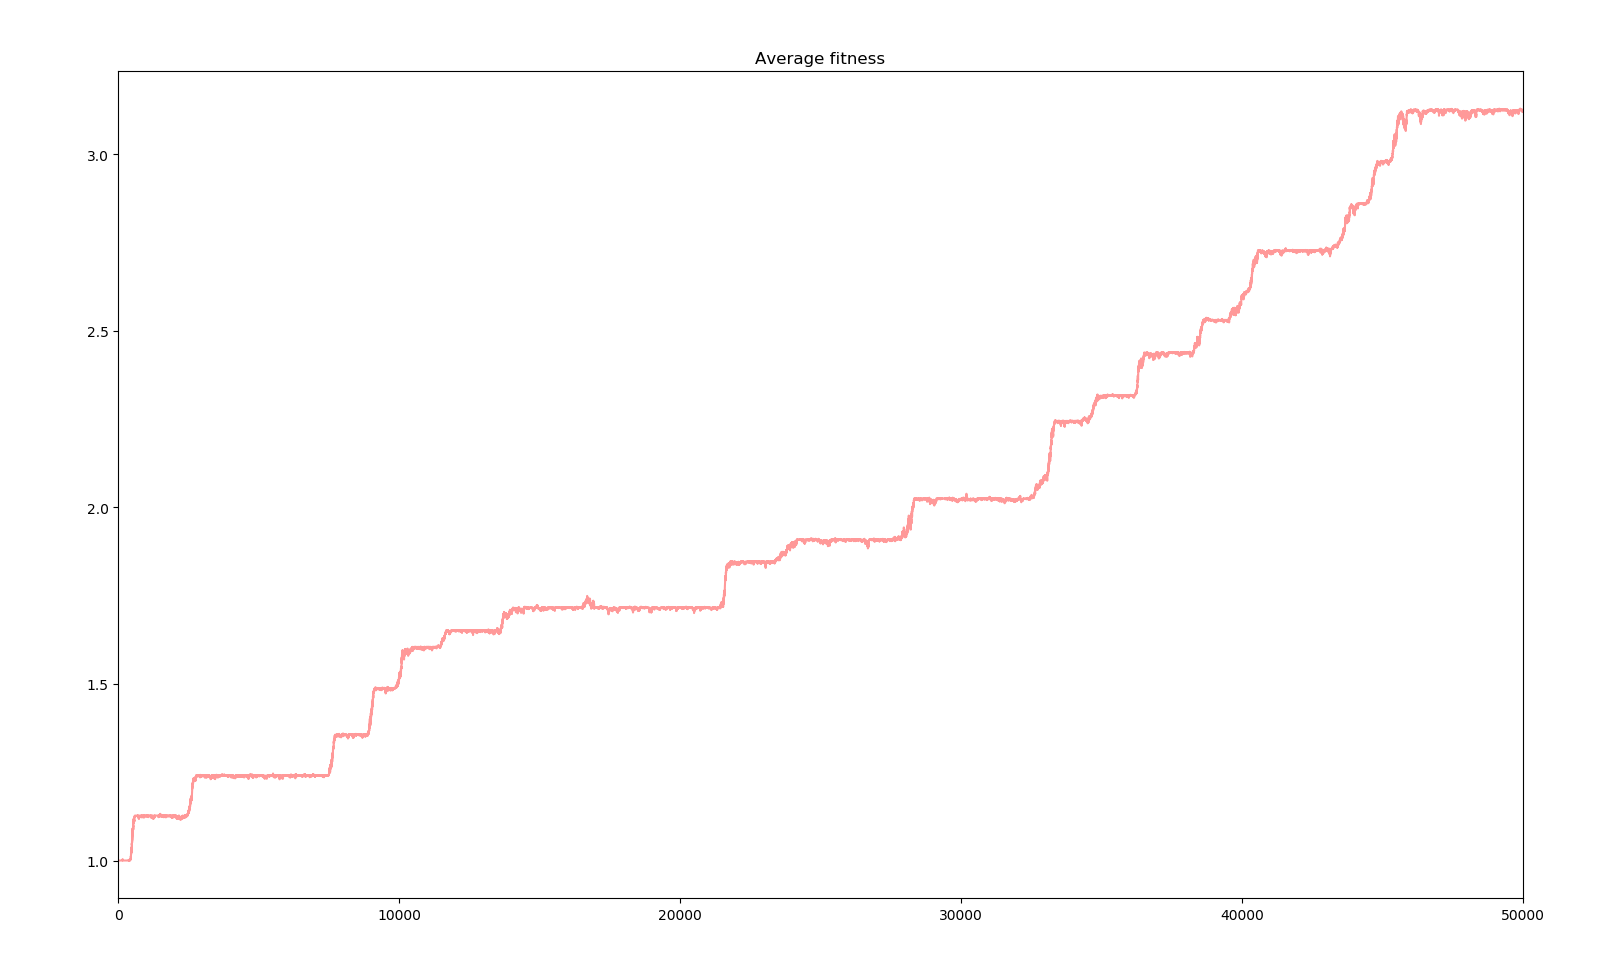
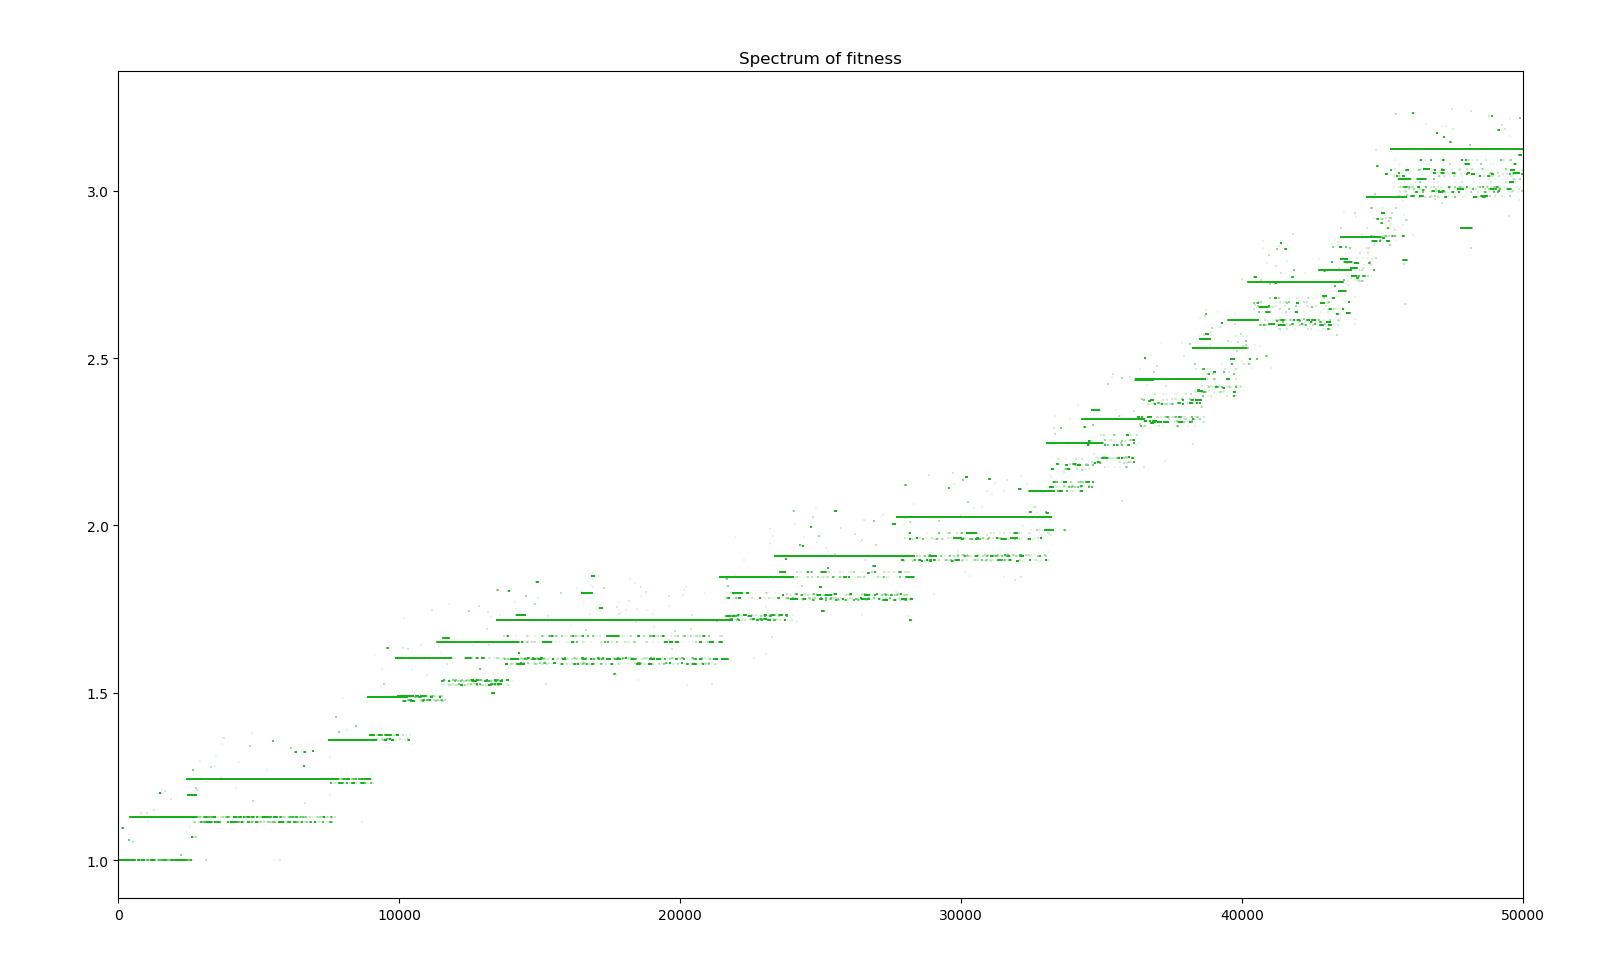
1 simulation of 50000 years
We can see that for every big jump in fitness, that is a major positive gene has dominated the whole population, a straight line in the spectrum indicates the default of the population with all the positive genes acquired ever since. Bellow this line, the many dots represent the creatures who have mutated a new negative gene or lost a positive gene, and above those with a new positive gene. There are more dots bellow the line due to the distribution of the effects of new genes. Also, the more genes there are in the population, the bigger the cloud bellow the line is as there are more genes to be lost. Positive genes are simply too rare and even when they appear, the selectivity factor is small enough that their survival advantage doesn't guarantee them survival.
Fifth version
In real life biology, genes don't just appear and disappear. The gene system now allows gene duplication (copy), modification (effect is rerolled with the same distribution as for a gene creation), turn off (the effect is no longer counted in the fitness of the creature) and turn on. A duplicated gene is set to inactive and needs to be turned on. Gene deletion still happens with a lower probability. Gene creation no longer exists. New genes appear with a duplication followed by a modification mutation and a turning on mutation.
When a gene is duplicated, an issue appears : if it is copied with its effect but just turned off, then a simple turn on mutation is enough to double the effect of the original gene, something that doesn't really mirror real life. In real life, genes encode for proteins and having two copies of the gene doesn't just double the effect of the protein. Therefore, copied genes are set to a null effect as well as turned off.
Actually, real genes are based on DNA sequence and the mutation affects this sequence of letters, base pairs, through insertions, deletions, duplications and other more complicated mutations. However, for this simulation, the simplifications made above are accurate enough.
To set the probabilities, I turned once again to the literature. I'm not a biologist and searching the literature often without access to the full papers makes finding what I'm looking for tricky. My main source for duplication and deletion rates is Copy-number changes in evolution: rates, fitness effects and adaptive significance - Katju et al. Frontiers in Genetics 10 December 2013, a meta study on the topic. From this, we get a duplication rate of $$10^{-3}$$ to $$10^{-5}$$ per gene per generation for prokaryotes such as bacteria and $$10^{-5}$$ to $$10^{-7}$$ per gene per generation for eukaryotes such as human sperm. The deletion rate in bacterium is estimated to be around $$10^{-4}$$ to $$10^{-8}$$ per gene per generation for bacteria and $$10^{-5}$$ to $$10^{-6}$$ per gene per generation for human sperm and up to $$10^{-7}$$ per gene per generation in genome-wise estimations for other species (a small worm and an insect).
For the gene modification mutation rate, in real life, base pairs mutations occur with a probability of about $$10^{-9}$$ per letters of the genome sequence. A gene is coded by about 1000 base pairs per year. Therefore a typical bacterium with around 1000 genes, $$10^6$$ base pairs, would have a mutation rate of $$10^{-3}$$. According to Rates of spontaneous mutation - Drake JW et al. Genetics 148 (4) 1667-86 April 1998, it actually is about 0.003 mutations per genome per cell generation, close enough to my back-of-the-envelope calculation.
Gene turn on and off is a bit more difficult to estimate. In biology, genes can be turned on and off, such as genes in humans to produce certain vitamins we now need to get from food, but there is also gene expression. As I could not find freely available papers on the topic with clear figures, I'm gonna make a rough estimate and say it has a higher probability than the other mutations.
Another modification necessary for this new system to work was to replace the base fitness of $$1.0$$ by an equivalent base set of $$50$$ genes each with a value of $$0.02$$.
| Parameter | Description | Value |
|---|---|---|
| $$N_0$$ | Starting population | $$20$$ |
| $$n_0$$ | Initial number of genes | $$50$$ |
| $$g_0$$ | Initial genes values | $$0.02$$ |
| $$E_0$$ | Initial population energy | $$1.0$$ |
| $$E_{tot}$$ | Total yearly energy supply | $$10.0$$ |
| $$E_-$$ | Yearly energy consumption | $$0.1$$ |
| $$E_s$$ | Fitness selectivity | $$1.0$$ |
| $$p_d$$ | Base death probability | $$0.01$$ |
| $$p_{ds}$$ | Death probability energy skew coefficient | $$1.0$$ |
| $$\alpha_{r}$$ | Share of the parent's energy given to the child | $$0.4$$ |
| $$m_{r}$$ | Reproduction probability multiplier | $$1.0$$ |
| $$\sigma_{r}$$ | Reproduction probability spread | $$8.0$$ |
| $$\gamma_{r}$$ | Reproduction probability skew | $$0.5$$ |
| $$\delta_{r}$$ | Reproduction probability bias | $$-10.0$$ |
| $$p_{gd}$$ | Gene deletion probability | $$0.000001$$ |
| $$p_{gc}$$ | Gene copy probability | $$0.0001$$ |
| $$p_{gon}$$ | Gene turn on probability | $$0.01$$ |
| $$p_{gof\!f}$$ | Gene turn off probability | $$0.01$$ |
| $$p_{gm}$$ | Gene modification probability | $$0.003$$ |
| $$\gamma_{g}$$ | Gene effect skew | $$-6.0$$ |
| $$\delta_{g}$$ | Gene effect bias | $$0.32$$ |
| $$m_{g}$$ | Gene effect multiplier | $$0.55$$ |
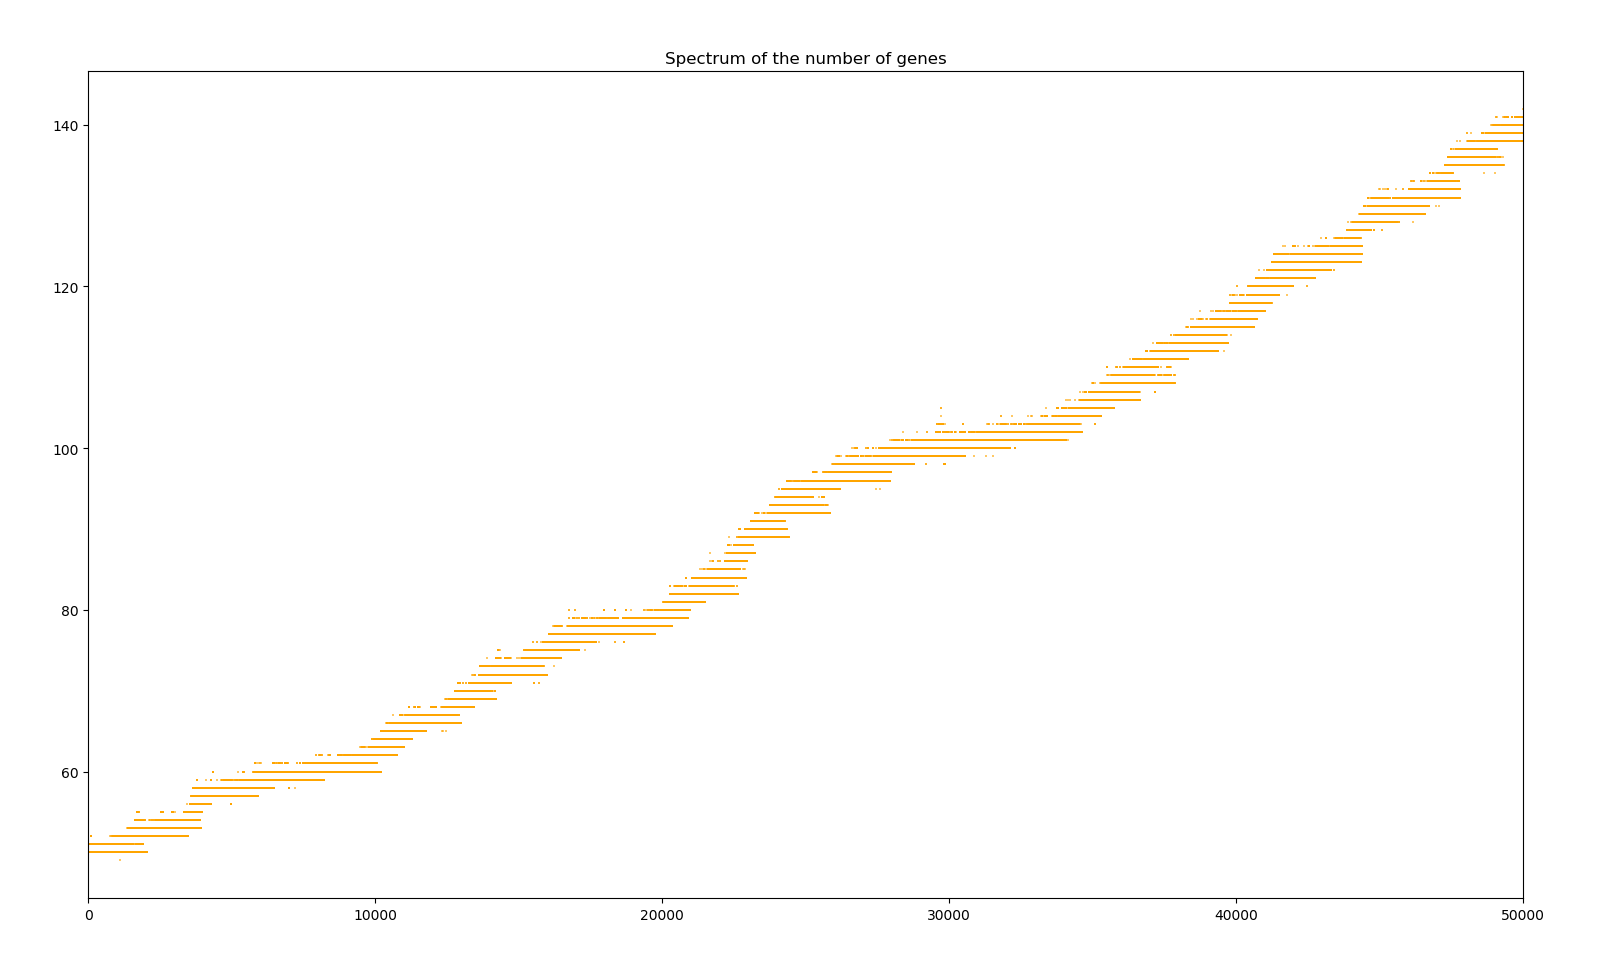
1 simulation of 10000 years
In Python, a simulation of the first 2000 years takes about 4 seconds on my computer and the simulations slows down as the number of genes increases to 8 seconds for the years 48000 to 50000. If the number of genes keeps increasing linearly, a simulation of a million years would take at least 6 hours ; and 3 weeks for ten million years ! Increasing the population to something more akin that of a species and the number of genes to that of even a small bacterium with about 1000 genes would make the simulation take years on my poor poor computer.
However, even starting at only 50 genes, it reaches 140 genes in only 50000 years. If it does continue linearly, after a million years, each creature will have about 1850 genes, 18000 after ten million years. Viruses have less than 100 protein-coding genes. Prokaryotes such as bacteria have between 500 to 5000. Eukaryotes have at least in the 10000, and humans have over three billion ! Therefore our simulated creature jumps from virus to fongi in ten million years in term of genome size and even to small animal in one order of magnitude longer. That is why it might be interesting to slow down this growth in future version by, for instance, making the creature consume more energy with the size of its genome. But then the supply from the environment won't be enough to carry a sufficient population. Therefore a larger overhaul of the simulation would be required.
Bacteria colony
Just for fun, I wanted to simulate a colony of bacteria. From what I read, a typical inoculation of a petri dish consists of about $$10^{4}$$ organisms and a typical bacterium has about 1000 genes. The yearly supply of food has also been updated to carry around 1000 bacteria. The simulation used 1Gb of RAM and 25% of my Intel Core i78650U running at about 3GHz due to thermal throttle. Each year took about 4 seconds to simulate.
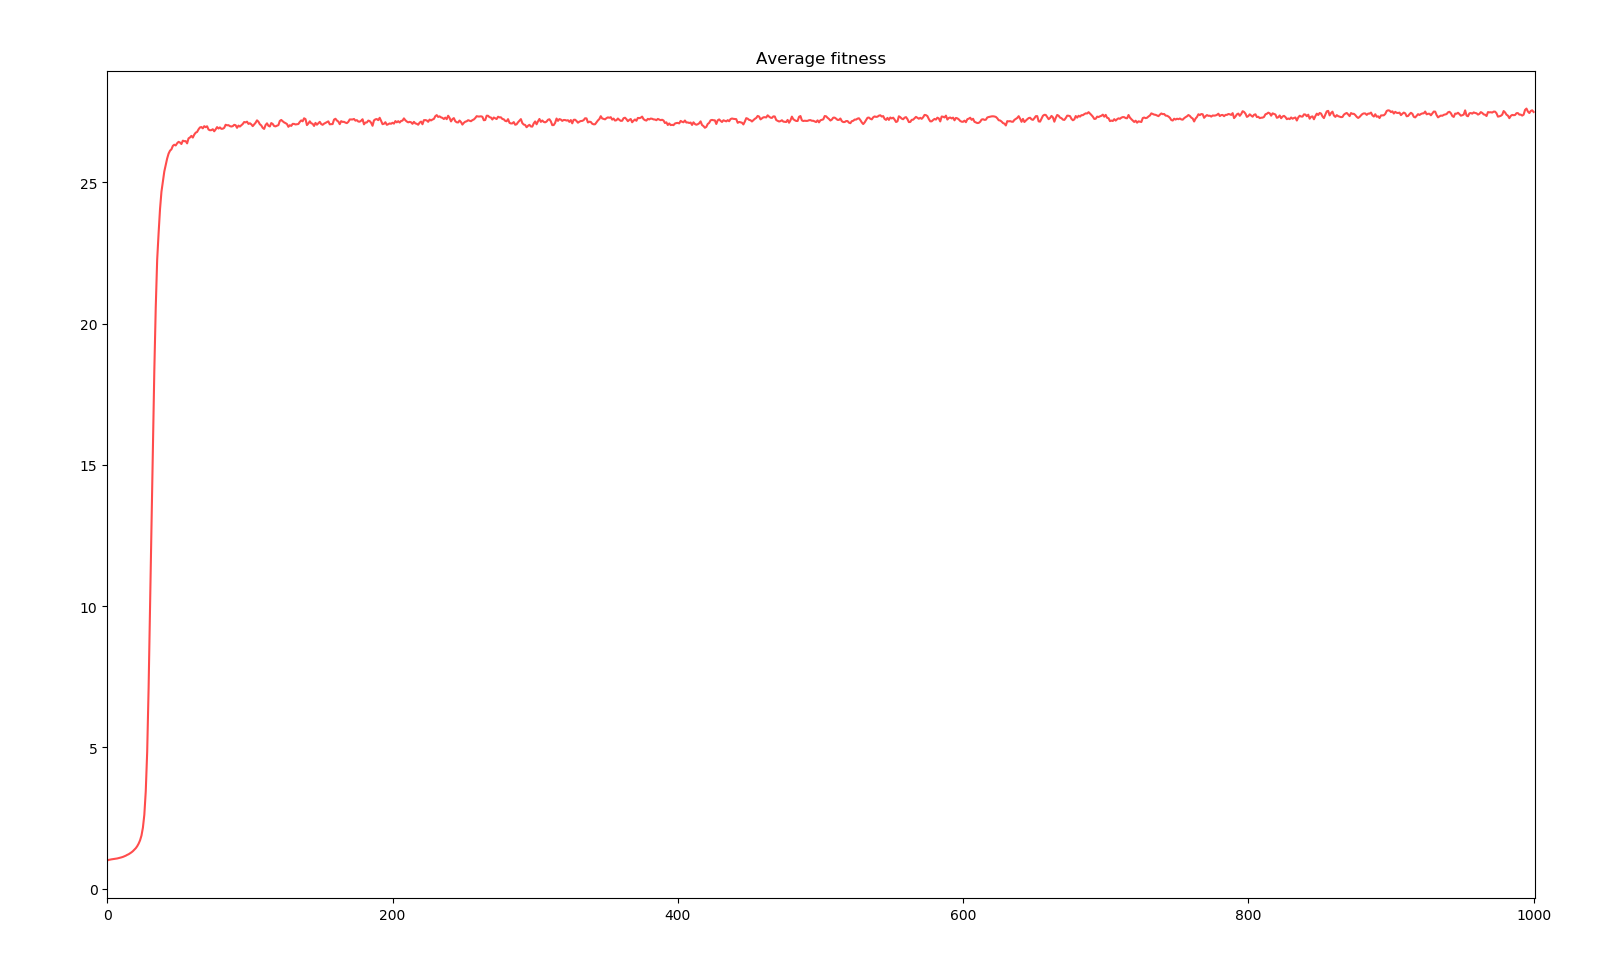
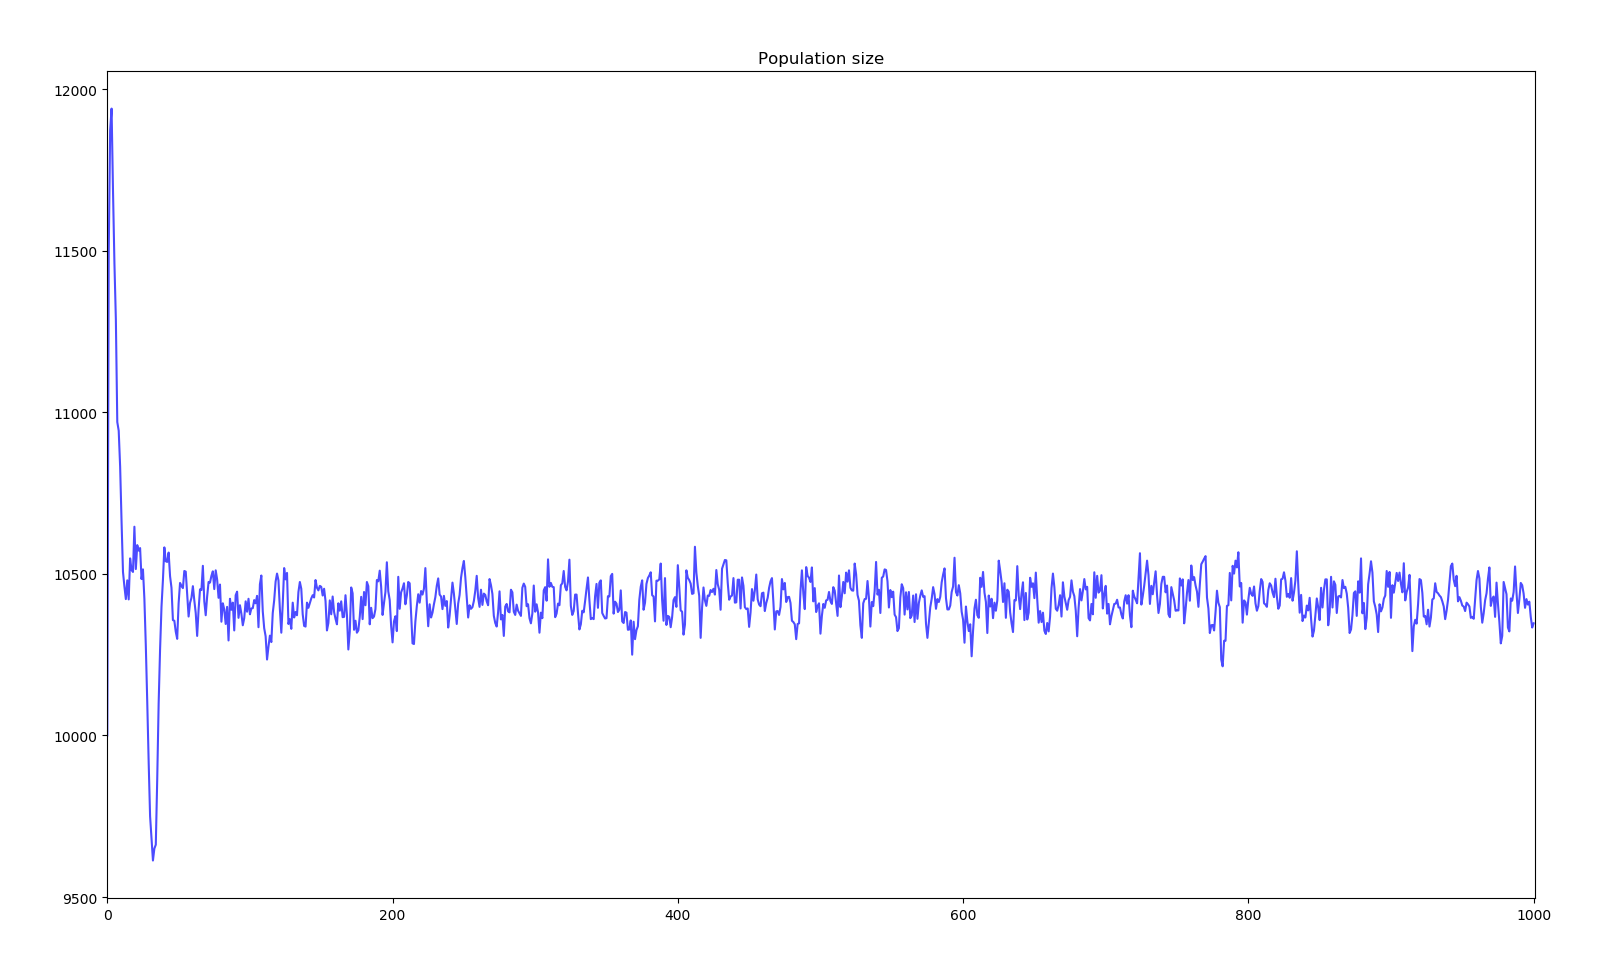
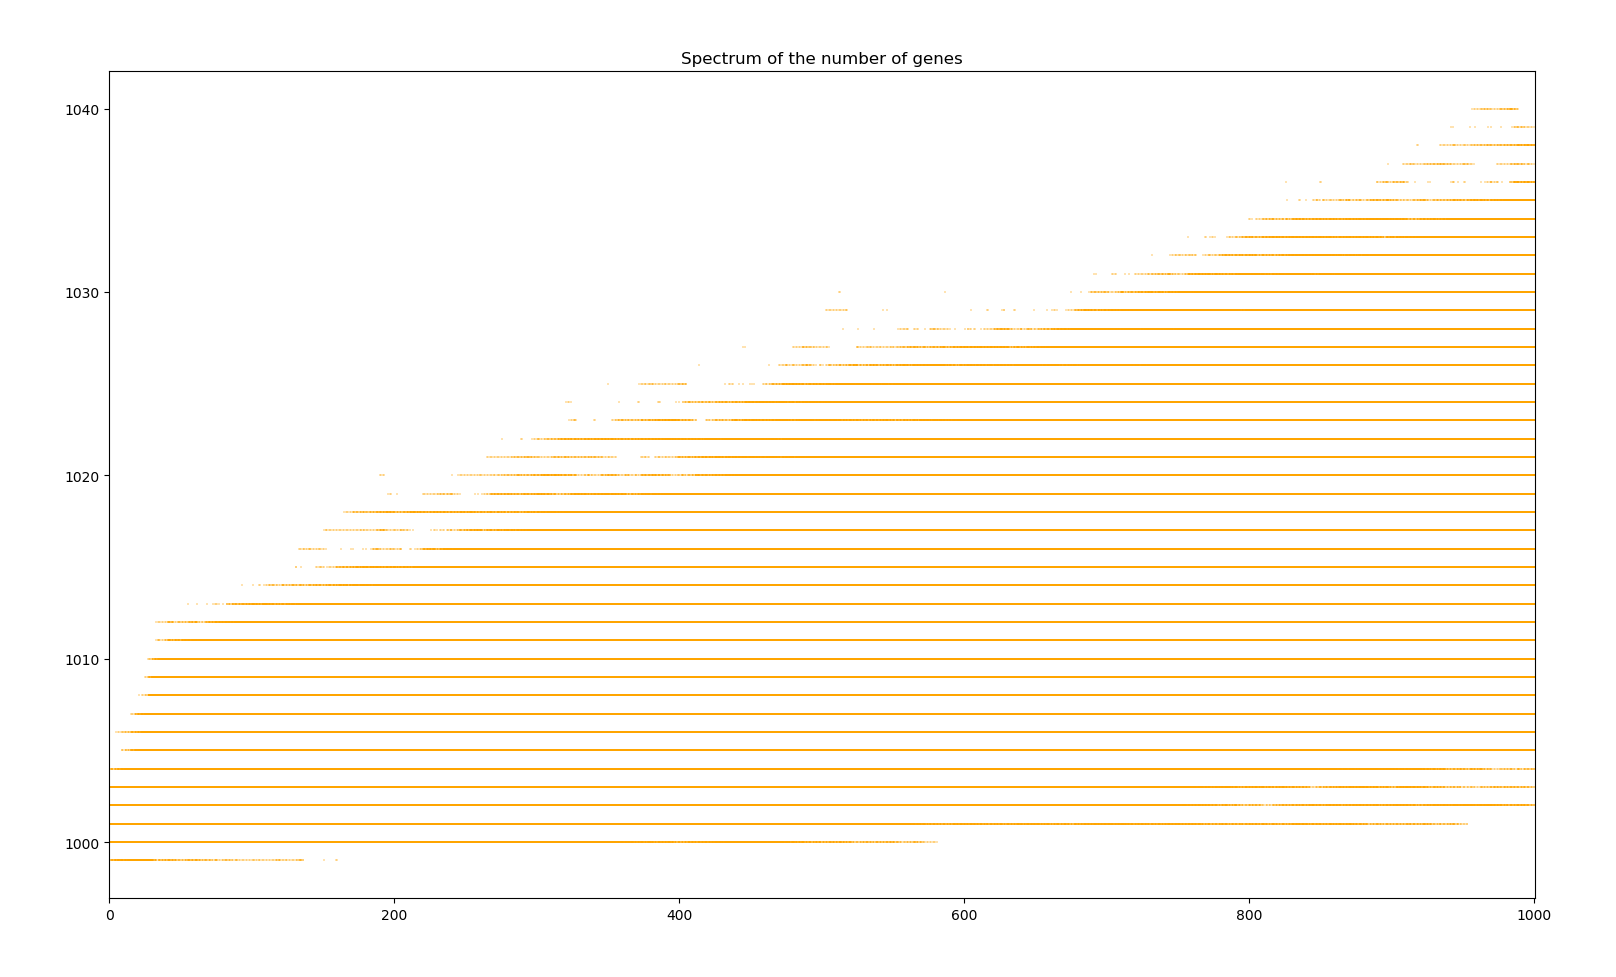
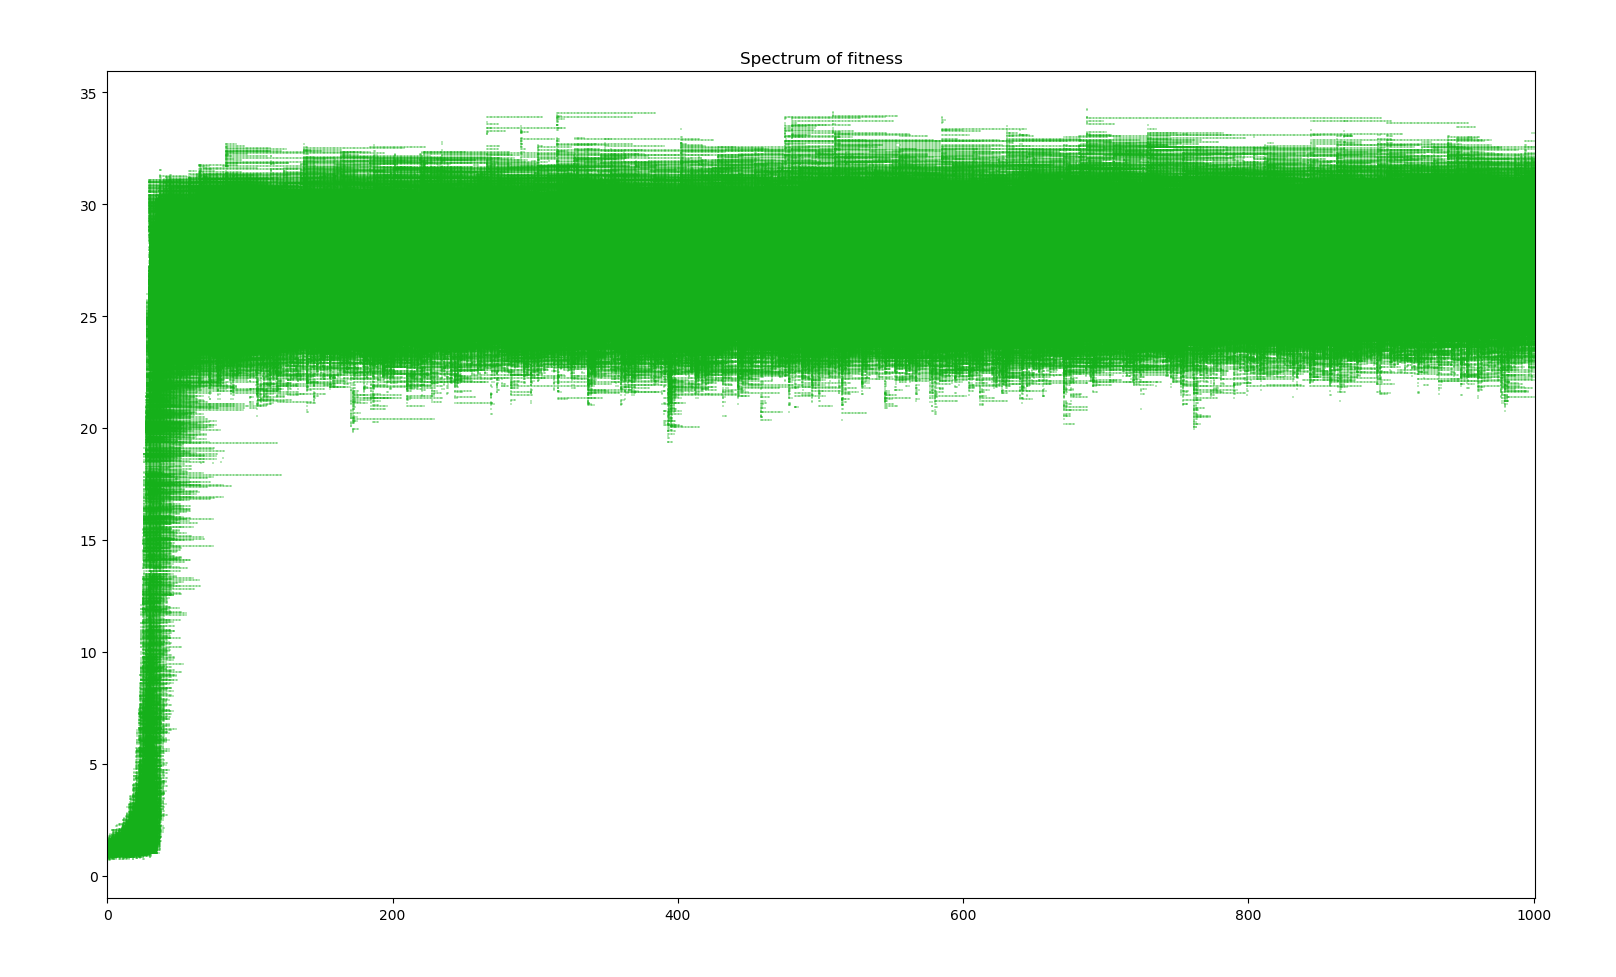
Simulation of bacterium colony for 1000 generations
We can observe two main phases. The first 50 years see a sudden jump in average fitness increasing 2700%. The population size also does some crazy jumps above and bellow the equilibrium. This phase corresponds to all the base genes undergoing modification mutations and having a reroll close to the most positive effects the random distribution can probabilistically give. Then, the next phase sees a slower evolution in the order of 1 fitness point per 1000 years. Here, further evolution requires the creation of new genes through duplication, modification and activation. The existence of the first phase is due to the initial genome given to creatures. A more realistic bacterium would have evolved more effective genes before reaching such a large genome.
Other versions
I made a few more modification but they didn't affect the results much or made the simulation unstable so I won't go into details explaining them.
First I changed the food supply system so that the entire supply is not necessarily distributed every year. Basically every creature seeks a certain amount of food. If there is too little food in the environment, then each creature will still get a share according to their fitness and the selectivity function, and the environment will be almost completely depleted. If there is more food than the sum of every creature's wants, then they each get what they need plus an extra, also using the selectivity. Therefore, when resources are plentiful, selectivity has a lower impact and fitter creatures can't just get so much food that they pump out babies like there is no tomorrow.
I then made the environment recover proportionally instead of just resetting the food supply to the same amount every year. However that was way too unstable. Either the environment would grow exponentially, which I solved by adding a maximum, but I was then always constant at that maximum. Or the number of creature would exceed the point of equilibrium between consumption and recovery and the environment would quickly die soon followed by the death of the population as the phenomenon was too quick for the population to reach a new equilibrium or even oscillate. I scrapped that whole idea for now. My best guess is that the simulation steps are just too long. In one or two iterations, creature can go from too much energy to dead starving and from one creature to multiple.
Finally, I made every creature age and the older they got, the more likely they were to die. That had almost no impact on the simulation results. This system could however be more useful and interesting for a later simulation with sexual reproduction and a greater variety of gene expression to ensure an exceptionally good roll won't survive centuries still producing babies.
I also translated the whole simulation to C++ and saw a significant boost in performance, almost 100 times faster ! I tried multithreading the simulation but ran into weird bugs even with mutex. I will look more into this and might need to call StackOverflow for help.
Future simulations
This was my first go at an evolution simulation and we were able to observe many fascinating phenomena. I definitely want to keep working on this topic. Future simulations will be centered on mechanics such as multiple attributes (instead of a single fitness number), sexual reproduction, genetic drift and speciation through isolation, predator-prey system, geographical evolution and population dynamics, social behavior and altruism, family structure and baby to mature growth, etc.